In the ever-evolving world of trading, having the right tools at your disposal is crucial. One such tool that can significantly enhance your trading strategy is a stock screener. Today, we’ll explore how to effectively use a stock screener with a focus on the S&P 500, helping you identify potential investment opportunities.
Getting Started with Your Watchlist
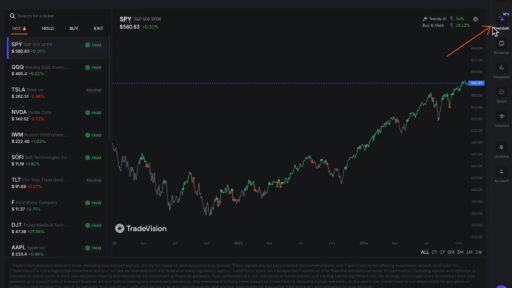
First things first: selecting your watchlist. You can choose from various options, including the S&P 500, NASDAQ 100, or your custom list. For this demonstration, we’ll stick with the S&P 500, which provides a solid foundation of large-cap stocks.
Understanding Key Metrics
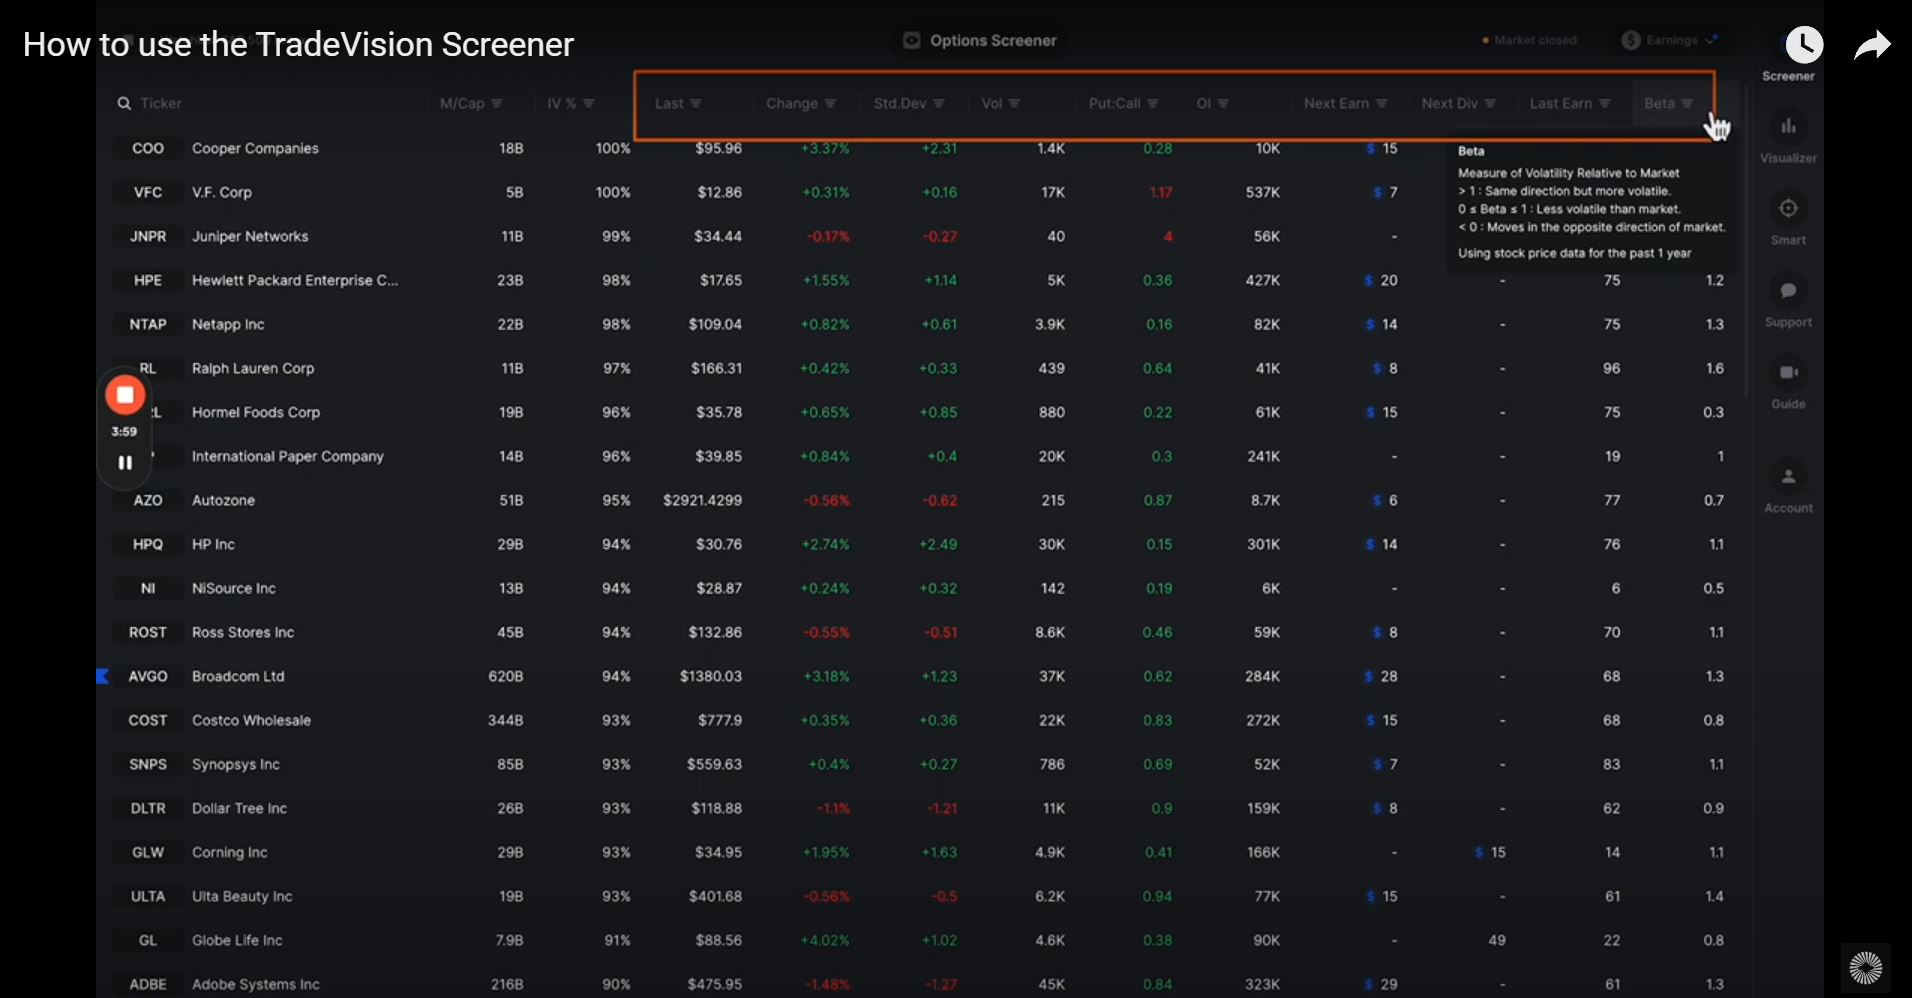
Once you’ve set your watchlist, it’s time to dive into the columns available in the screener. Each column provides valuable data about the stocks, allowing you to sort and filter based on your investment criteria.
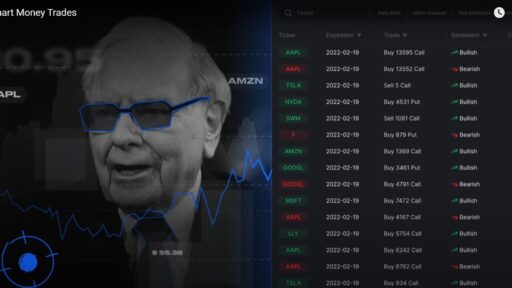
Market Capitalization is one of the most crucial metrics. It represents the total dollar value of a company’s outstanding shares. By sorting this column from highest to lowest, you can quickly identify the biggest players in the S&P 500. As of now, Microsoft leads the pack at $3.1 trillion, followed closely by Apple at $2.9 trillion and NVIDIA at $2.3 trillion. Understanding market cap helps you gauge a company’s size and stability.
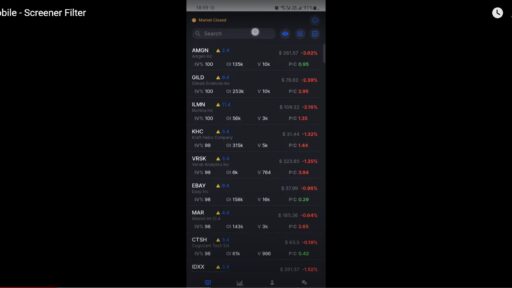
Analyzing Implied Volatility
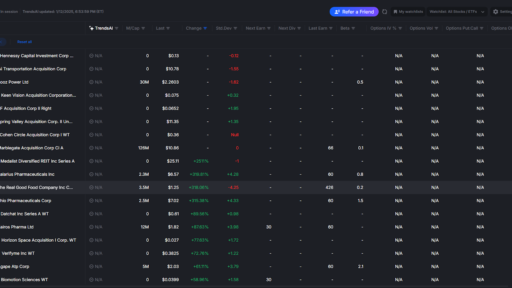
Next, let’s explore Implied Volatility (IV). This metric indicates how much the market expects a stock’s price to fluctuate in the future. By sorting the IV column, you can uncover stocks with the highest volatility. For instance, Cooper Company may rank first with an IV of 100%. High IV can signal potential price swings, making these stocks intriguing for traders looking for opportunities.
Filtering by Earnings Reports
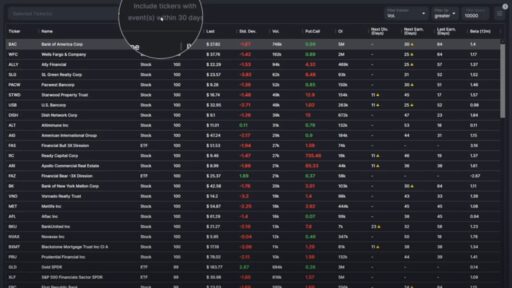
Earnings reports can significantly impact stock prices, so it’s essential to incorporate this factor into your analysis. The screener allows you to filter stocks based on upcoming earnings. You can choose to include stocks with earnings scheduled within the next 30 days or exclude them entirely.
For example, by excluding stocks with upcoming earnings, you can focus on those with less immediate risk. Conversely, if you’re willing to embrace uncertainty, including these stocks could reveal high-risk, high-reward opportunities.
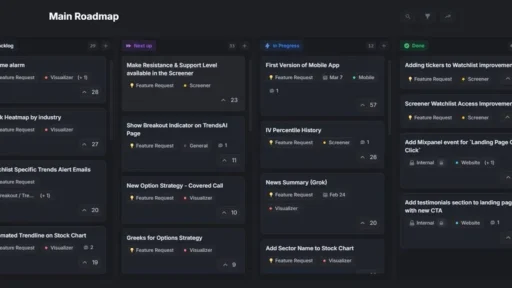
Customizing Your Screen
The flexibility of the stock screener allows you to mix and match various filters. In addition to market cap and implied volatility, consider other metrics like:
- Last Price Change: Understand recent stock performance.
- Percentage Change: Track the stock’s price movement relative to previous values.
- Open Interest: Gauge the total number of outstanding options contracts.
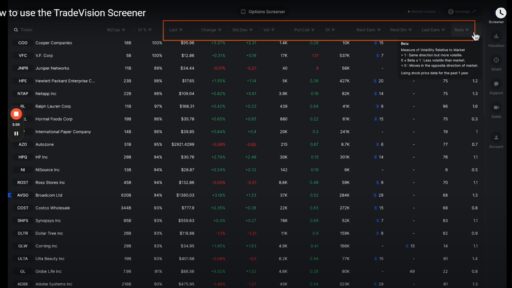
- Beta: Measure the stock’s volatility compared to the market.
These metrics can provide a comprehensive view of potential investments.
Resetting Filters for Fresh Insights
As you explore different stocks, don’t hesitate to reset your filters for a fresh start. This feature allows you to adjust your strategy based on evolving market conditions and new insights.
Conclusion
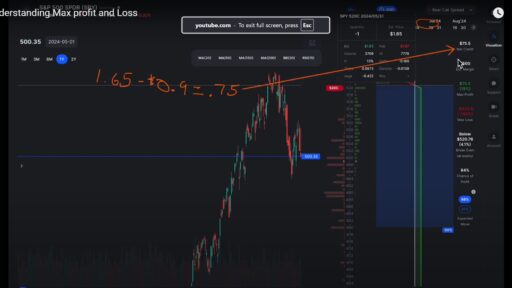
Using a stock screener effectively can empower your trading decisions, making it easier to identify stocks that align with your strategy. By focusing on key metrics like market capitalization, implied volatility, and earnings reports, you can streamline your analysis and uncover valuable investment opportunities.