Hey everyone! Today, we’re diving deep into one of the most powerful features on OptionsWatch.io: the Smart Money Insights tool. Whether you’re a seasoned trader or just starting out, understanding Smart Money Insights can give you a significant edge in the market. So, let’s explore how this feature can enhance your trading strategy.
What is Smart Money Insights?
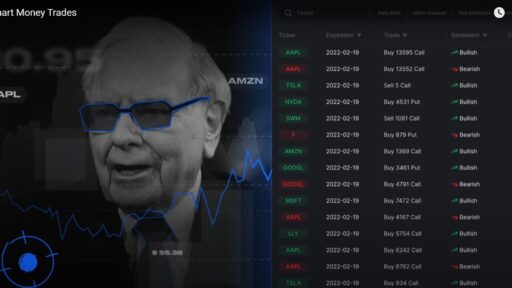
Smart money refers to the trades and investments made by institutional investors, experienced traders, or insiders who are believed to have a better understanding of market dynamics. OptionsWatch.io’s Smart Money feature allows you to track these sophisticated trades, providing you with insights into where the big players are putting their money.
Navigating the Smart Money Feature
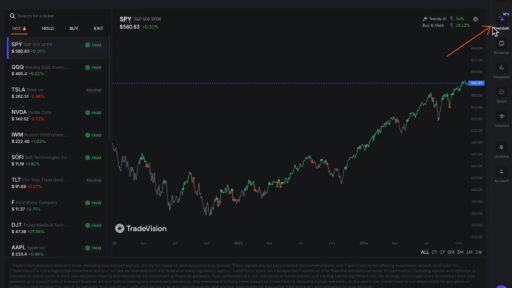
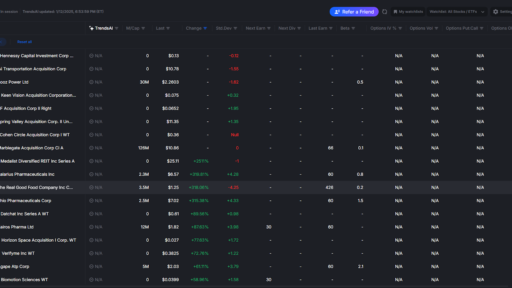
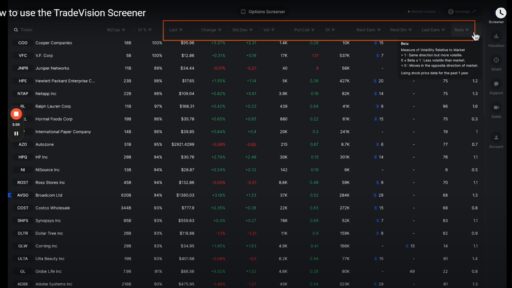
On the right-hand side of the OptionsWatch.io dashboard, you’ll find the Smart Money button. Clicking this will open up a detailed menu showcasing various metrics for unusual trades. Here’s a breakdown of what each column reveals:
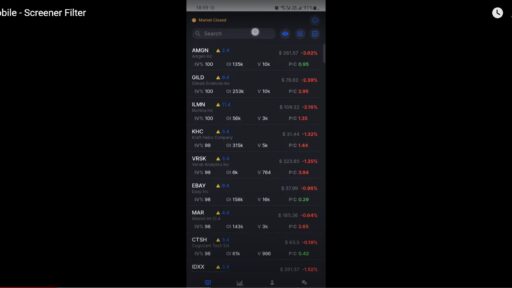
1. Ticker Symbol
This column displays the ticker of the stock involved in the trade. It’s your starting point for identifying which companies or ETFs are seeing notable smart money activity.
2. Expiration Date
This tells you when the options contract expires. Knowing the expiration date helps you gauge the time frame of the trade and its potential impact on the stock’s price.
3. Trade Type
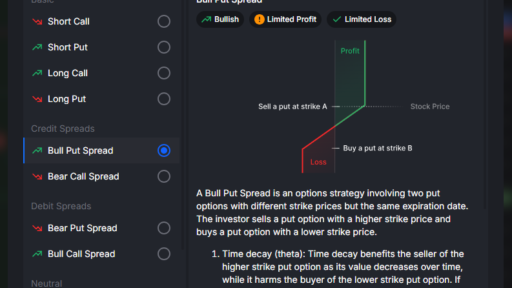
This column shows whether the trade was a buy or sell, and the specific type of option involved (e.g., sell put, buy call). This is crucial for understanding the trader’s market sentiment. For instance:
- Selling a put typically signals a bullish outlook.
- Buying a put generally indicates a bearish sentiment.
4. Sentiment
The sentiment of the trade provides insight into the trader’s market outlook. If a large trade involves buying puts, it might signal a bearish stance, whereas selling calls could indicate a more optimistic view.
5. Ticker Price
This displays the stock price at the time of the trade. It helps in assessing the context of the trade and the relative value of the stock when the trade was executed.
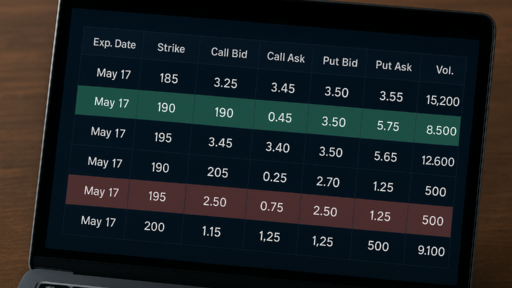
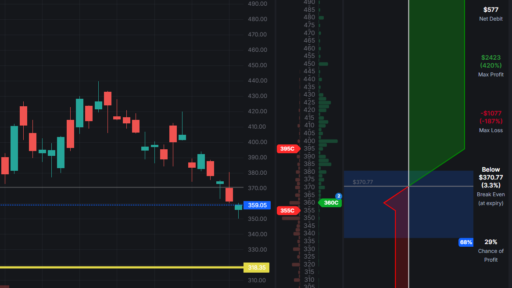
6. Strike Price
The strike price is the price at which the option can be exercised. This column allows you to see the levels at which traders are betting on the stock’s future performance.
7. Chance of Profit
This is a crucial metric that shows the likelihood of the trade being profitable based on current market conditions. A higher chance of profit suggests a stronger belief in the trade’s success.
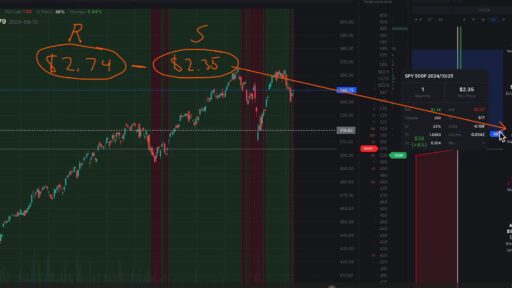
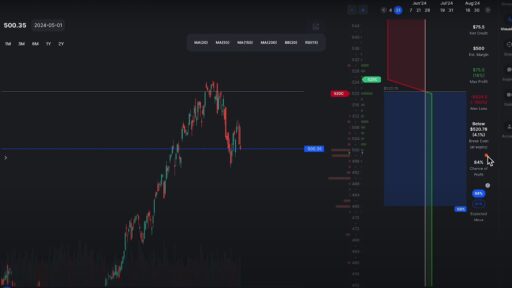
8. Premium
The premium is the cost or income of the options contract. If it’s a sell, it shows the amount received; if it’s a buy, it’s the amount paid. For example:
- A sell 51 put might show a premium of $531,000 received.
- A buy 5130 call might display a premium of $102,000 paid.
9. Time Since Trade
This column shows how long ago the trade was executed. It helps in understanding the timeliness of the trade and its relevance to current market conditions.
10. Unusualness
Unusualness measures the size of the trade relative to existing open interest. A large trade relative to open interest can indicate significant market moves or shifts in sentiment.
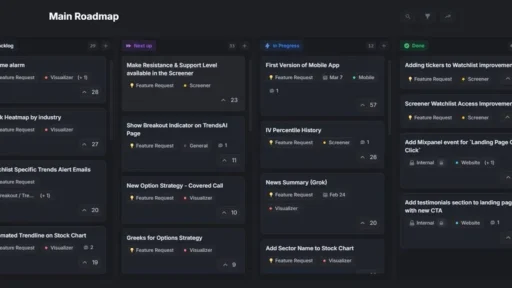
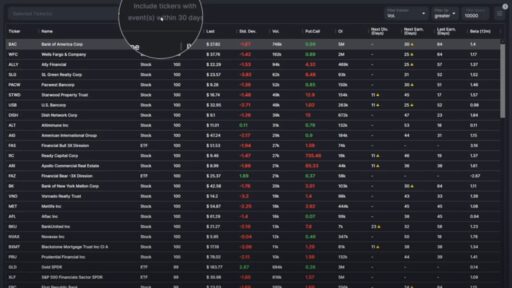
Advanced Filtering and Sorting
OptionsWatch.io offers powerful tools to filter and sort the data to match your trading strategy:
- Sorting: You can sort columns in ascending or descending order to see the most or least unusual trades, highest or lowest premiums, etc.
- Filters: Set filters for criteria such as premium size, chance of profit, and more. For example, filter for trades with a premium over $1 million or a chance of profit above 80%.
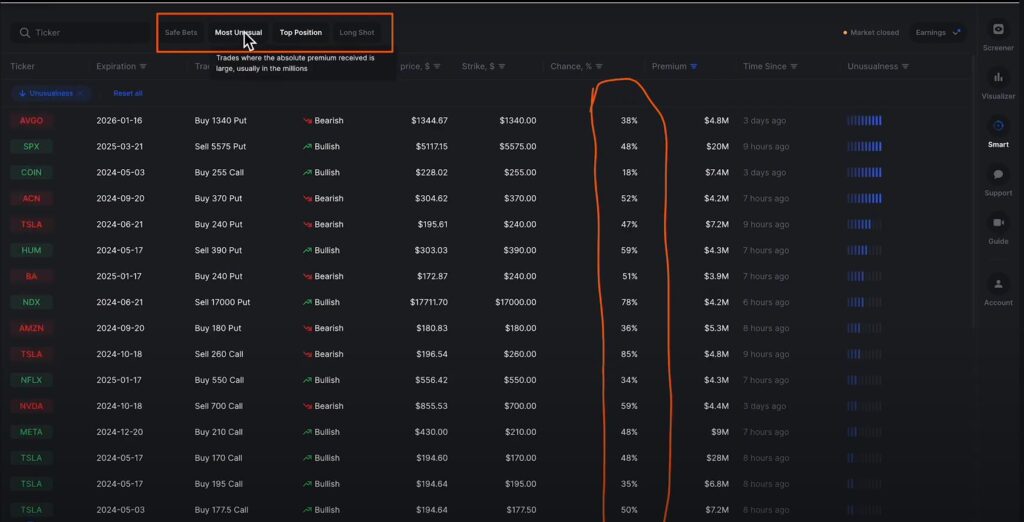
Customizing Your Search
To narrow down your focus:
- Search Bar: Use the search bar to type in specific tickers like SPY or IWM to see relevant trades.
- Filter by Categories: Use categories like “safe bets,” “most unusual bets,” “top positions,” and “long shots” to find trades that fit specific criteria.
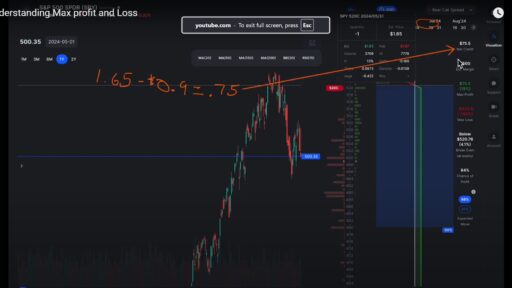
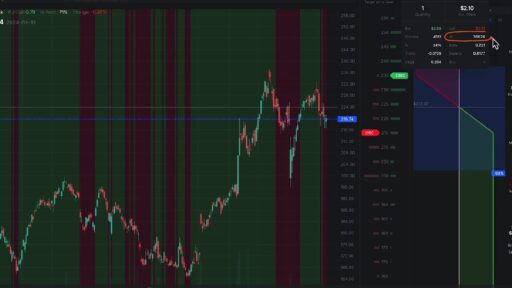
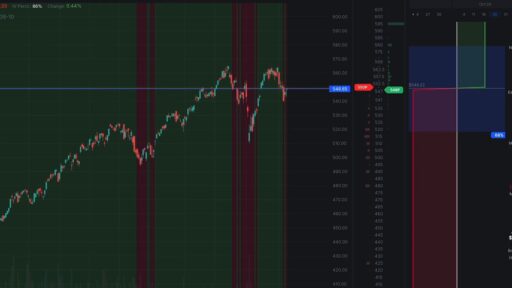
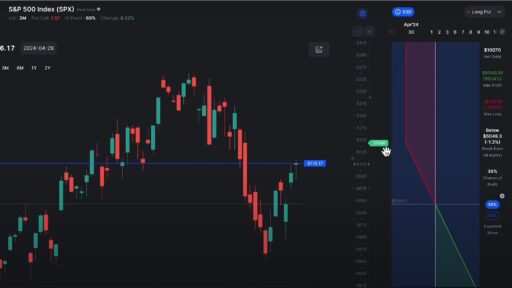
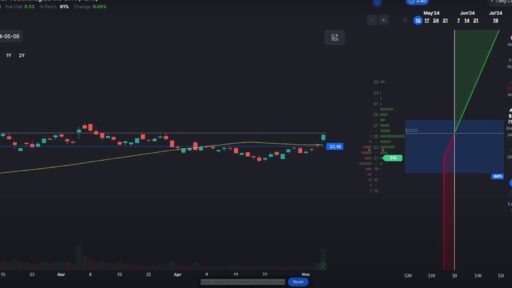
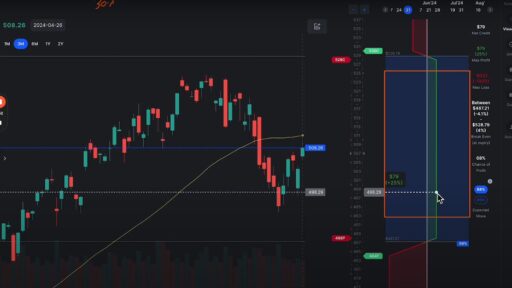
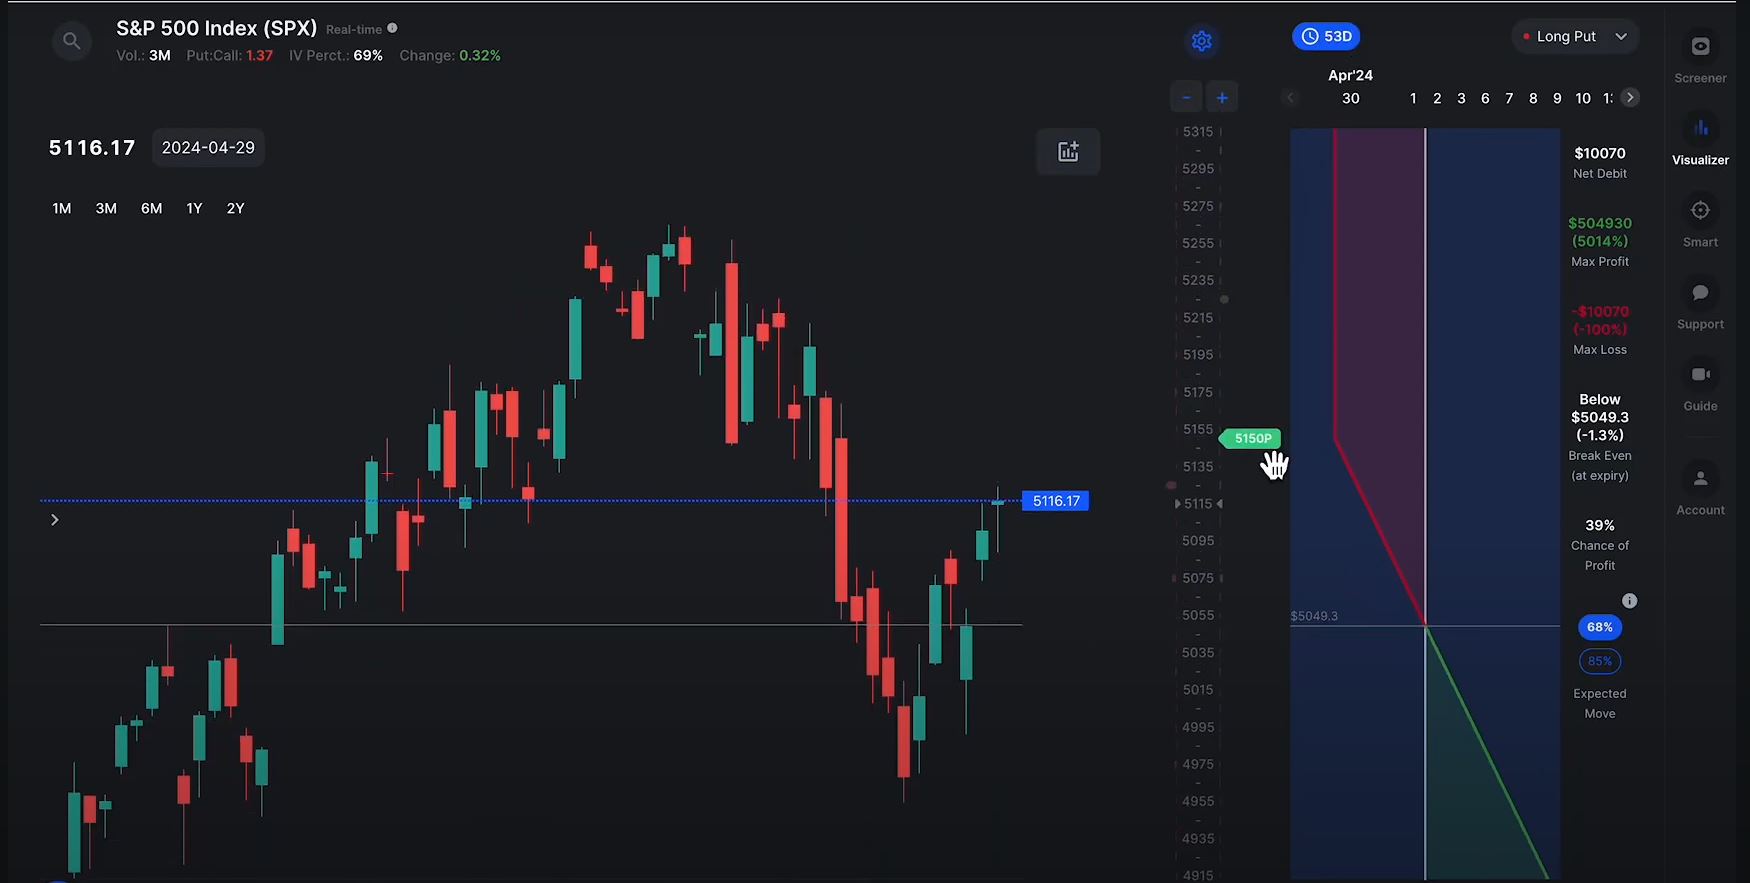
Visualizing Trades
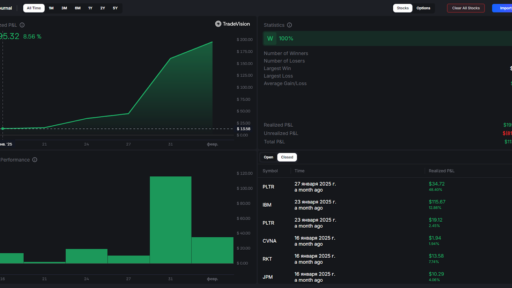
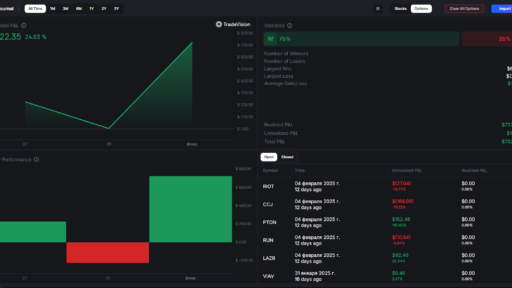
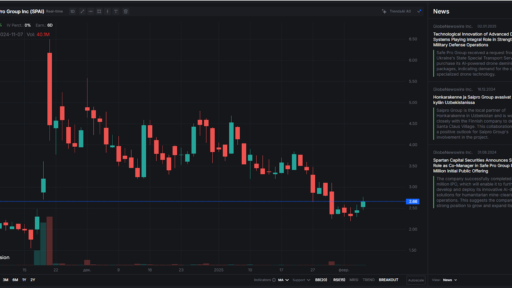
Click on any trade to view detailed insights and visualizations. This includes stock charts and metrics for the specific trade, helping you to analyze and interpret the data more effectively.
Conclusion
The Smart Money feature on OptionsWatch.io is an invaluable tool for traders looking to track and understand the moves of the big players in the market. By leveraging the detailed insights and filtering options, you can enhance your trading strategy and make more informed decisions.