Hey everyone! Today, we’re diving into a powerful concept that can enhance your trading strategy: the expected move. If you’re currently navigating the options market, this is an essential tool that can help you make informed decisions. Let’s break it down step by step.
What is the Expected Move?
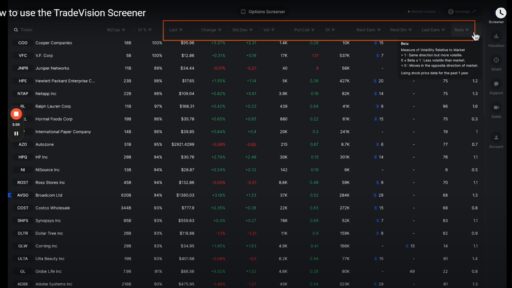
The expected move is a statistical measure that helps traders anticipate the potential price movement of an asset over a specified period. Typically, you’ll encounter two percentages: 68% and 85%. These figures represent different confidence intervals:
- 68% is one standard deviation, indicating that there’s a 68% chance the stock will move within this range by the expiration date.
- 85% expands this range, suggesting an 85% chance of the stock staying within the specified bounds.
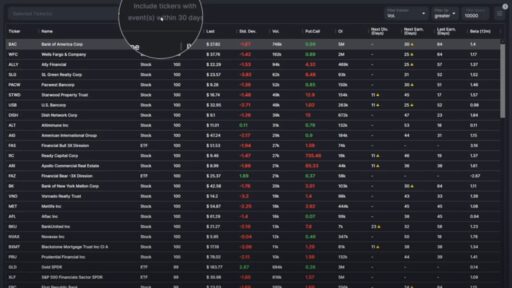
Using the Options Screener
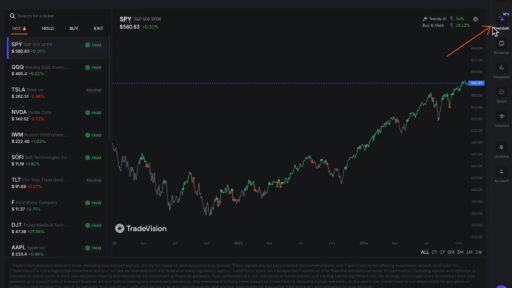
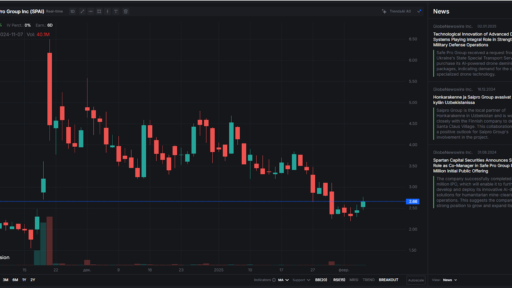
To see the expected move in action, let’s use a common ticker: SPY, the S&P 500 SPDR. Here’s how to access the expected move using your options screener:
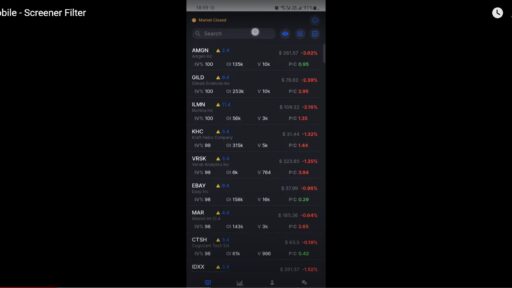
- Navigate to the Options Screener: Open your trading platform and go to the options screener.
- Select a Ticker: Type in “SPY” to pull up the stock chart and options chart.
- Choose an Expiration Date: For this example, let’s select an expiration date about 30 to 45 days out—say October 25.
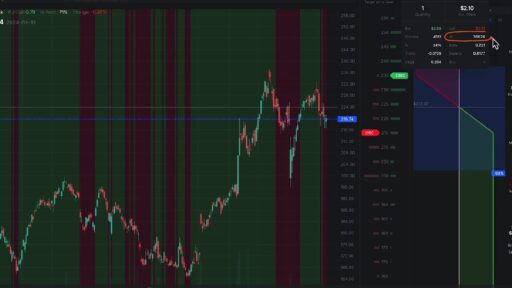
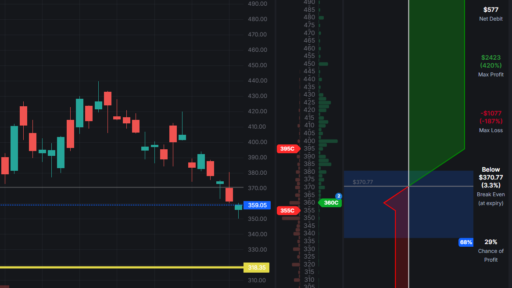
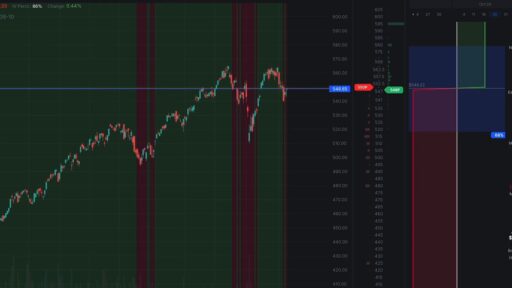
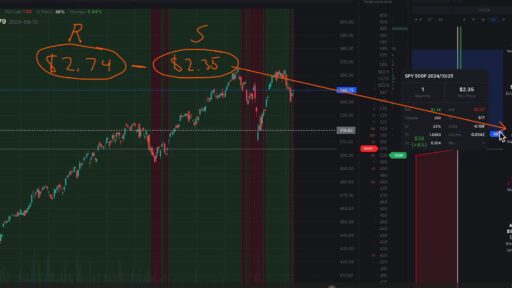
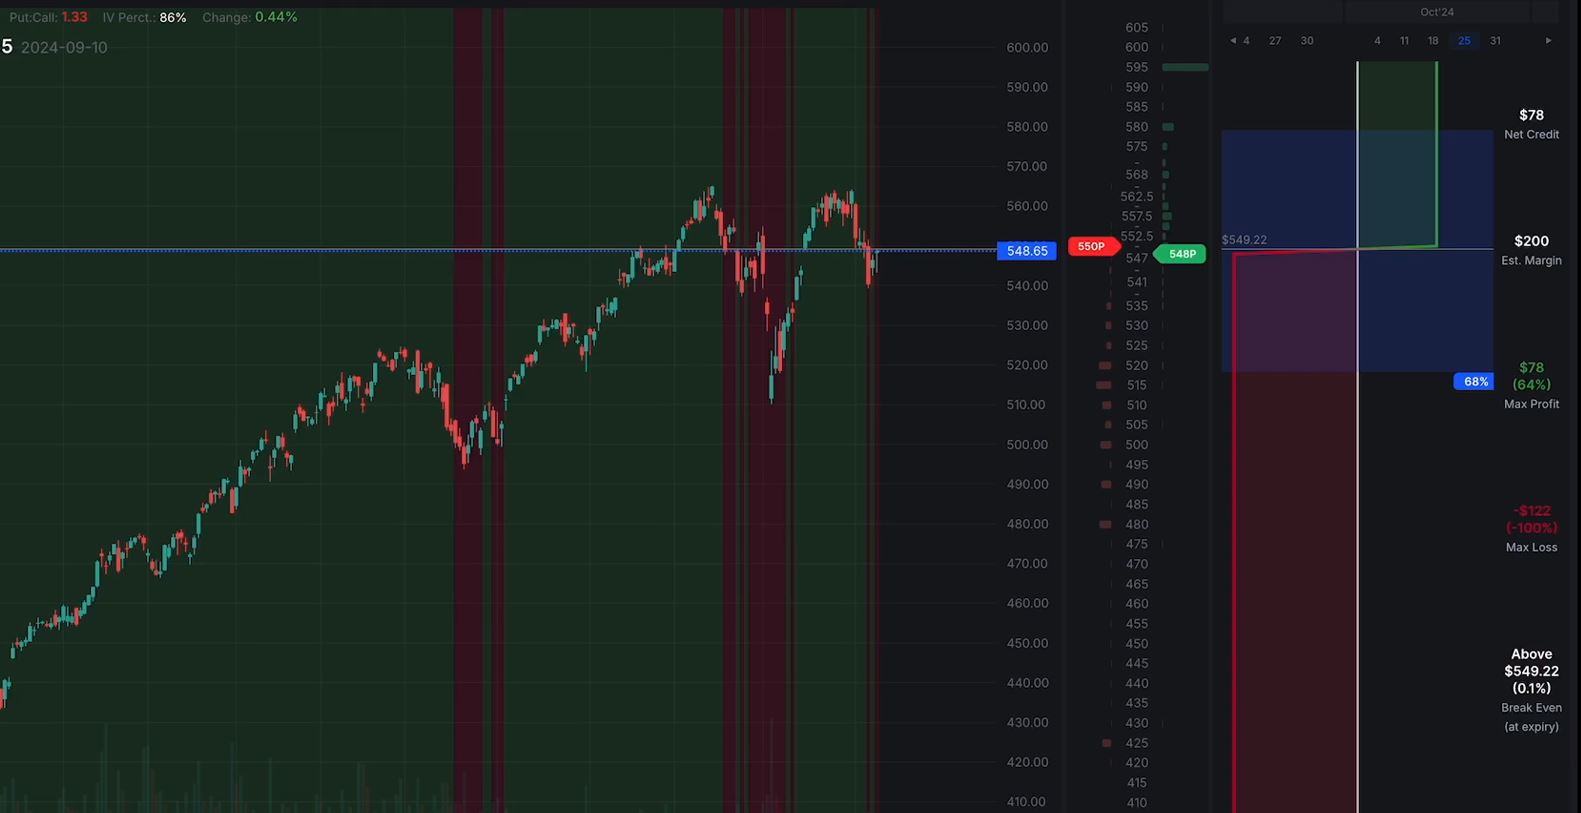
- Locate the Expected Move: In the bottom right corner, you’ll find the expected move, represented by blue rectangles on the stock chart.
Visualizing the Expected Move
For SPY, let’s say the current stock price is $548.68.
- 68% Expected Move: The blue rectangle indicates that by October 25, SPY is expected to move between approximately $520 and $575. This means there’s a 68% probability it will stay within this range.
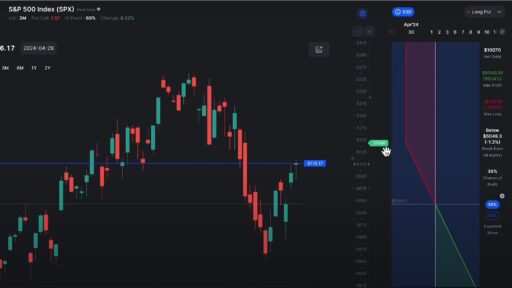
- 85% Expected Move: When you switch to the 85% probability, the rectangle expands. This broader range reflects a higher probability of SPY remaining between these values, though it comes with a wider potential price movement.
Trading Strategies Using the Expected Move
Understanding the expected move can help you implement various trading strategies. Here are a couple of examples:
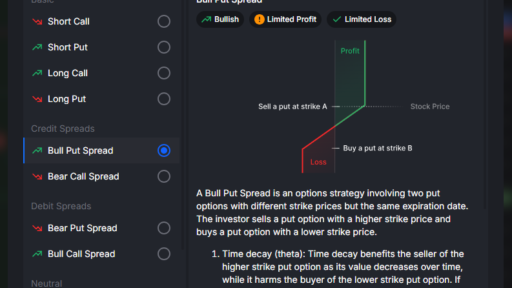
Bull Put Spread
If you’re bullish on SPY, consider a bull put spread. You might set your strike prices near the lower end of the expected move (e.g., below $520). This strategy allows you to capitalize on SPY’s anticipated upward movement while managing risk.
Bear Call Spread
Conversely, if you believe SPY might decline, a bear call spread could be the way to go. Here, you would set your strike prices near the upper end of the expected move (e.g., above $575), aiming to profit from a potential downward movement.
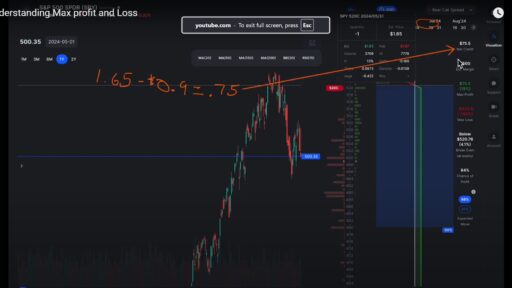
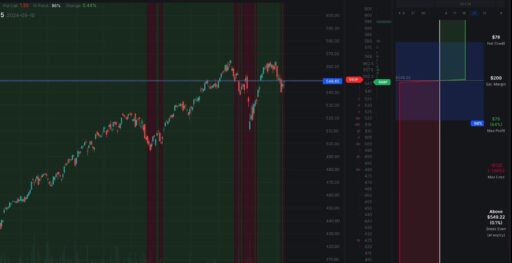
Iron Condor
For a more neutral approach, consider an iron condor. This strategy involves setting your strike prices at both ends of the expected move—taking advantage of the range and aiming for low volatility. You’d look at break-even points of approximately $570.01 (upper) and $517.99 (lower) to gauge your risk and reward potential.
Final Thoughts
While the expected move is a valuable tool, remember that it’s not foolproof. The market can be unpredictable, and external factors can influence price movements. However, by incorporating the expected move into your trading strategy, you can make more informed decisions and potentially enhance your trading outcomes.