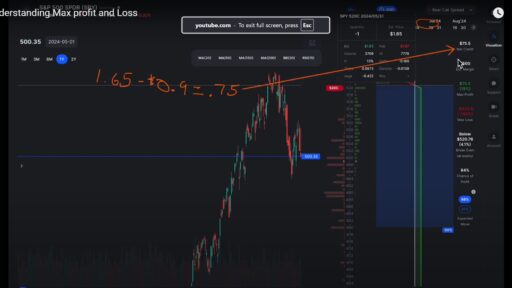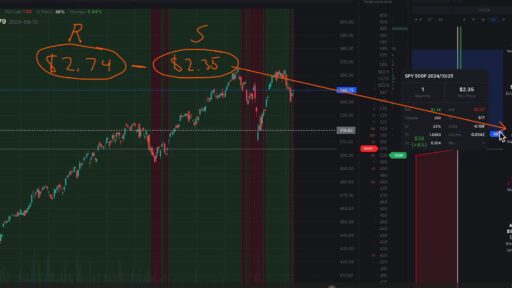
When it comes to investing in the stock market, one of the most critical questions for traders and investors alike is: how much can a stock be expected to move over a certain period? Understanding this stock anticipated moves can be essential for making informed decisions, and one of the best ways to calculate it is through options pricing. In this blog post, we’ll explore how you can utilize option costs to gauge the expected movement of a stock and the key factors that come into play.
What Determines a Stock Anticipated Moves?
The anticipated move of a stock can be calculated using three primary factors:
- Stock Price: This is simply the current trading price of the stock. For instance, as of this writing, Apple (AAPL) may be trading around $150, while Tesla (TSLA) is at approximately $250.
- Implied Volatility (IV): This metric reflects the market’s expectations for future volatility. Essentially, it provides insights into how much the market anticipates the stock price will fluctuate over a specific timeframe.
- Days to Expiration (DTE): This refers to the time remaining until the option contract expires. While it plays a role in pricing options, its influence on anticipated stock moves tends to diminish over time as traders generally utilize comparable timeframes.
Breaking Down the Expected Move
Among the three factors, the influence of DTE is often the least significant. This is because many traders tend to operate within similar timeframes, and its effect lessens after statistical adjustments. Thus, the two most crucial factors for assessing a stock’s expected move are:
- Stock Price: While important, it’s not the primary driver of anticipated moves.
- Implied Volatility (IV): This has a more substantial impact due to its tendency for larger and quicker fluctuations.
Analyzing Historical Data
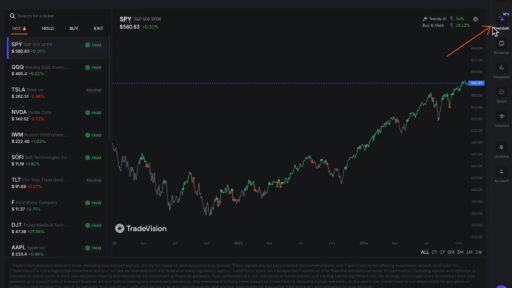
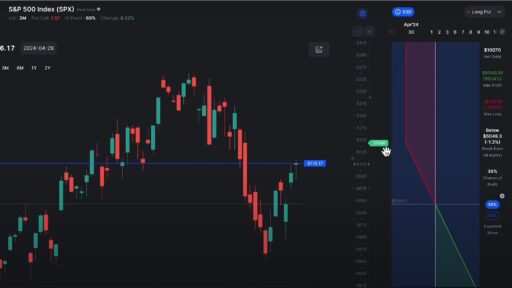
To illustrate the relationship between stock price and implied volatility, let’s examine data from the SPDR S&P 500 ETF (SPY) over the past decade. This ETF serves as a reliable benchmark for the broader U.S. stock market. Through our analysis, we observed that while SPY’s stock price could experience notable changes, the VIX (Volatility Index) tends to move more significantly and more rapidly.
For instance, if SPY were to double its anticipated move in a month, it would require an extraordinary 100% price change—something that’s highly unlikely. Conversely, an increase in IV from 10% to 20% is a far more common occurrence. This pattern reinforces why implied volatility is the most critical factor when determining a stock’s anticipated move.
Key Takeaways for Traders
For those engaged in trading, understanding the relative impact of these three core components is vital:
- Stock Price: While essential, it is not the most volatile element influencing anticipated moves.
- Implied Volatility (IV): This should be viewed as the primary driver due to its capacity for significant and rapid changes.
- Days to Expiration (DTE): Although it plays a role in options pricing, its influence is relatively minor compared to stock price and IV.
Conclusion
Calculating the anticipated move of a stock using options pricing can provide invaluable insights for traders and investors. By focusing on stock price and implied volatility, you can better gauge how much a stock may rise or drop in value over a set period. As you continue to refine your trading strategies, remember the importance of implied volatility in shaping market expectations—it could be the key to your next successful trade. Happy trading!