
In the dynamic world of stock trading, the ability to predict market movements can be a game-changer. One powerful tool in this arsenal is the concept of a “call walls,” and today, we’re diving into a recent example using Palantir Technologies to illustrate how this works in real time.
What Happened with Palantir?
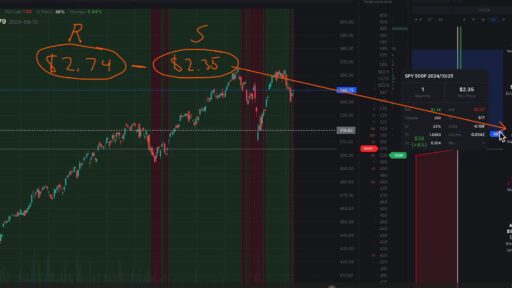
After Palantir reported its earnings yesterday, the stock experienced a notable spike, hitting our predetermined resistance line at $25 before subsequently retreating. This behavior wasn’t random; in fact, we had anticipated this reaction based on clear indicators in the options market.
The Call Wall Indicator
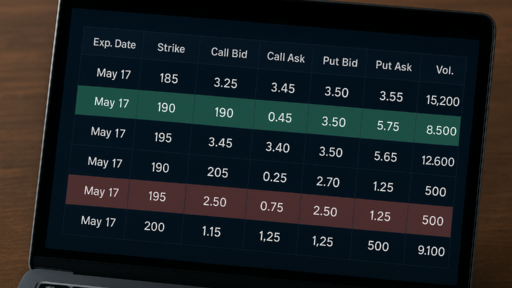
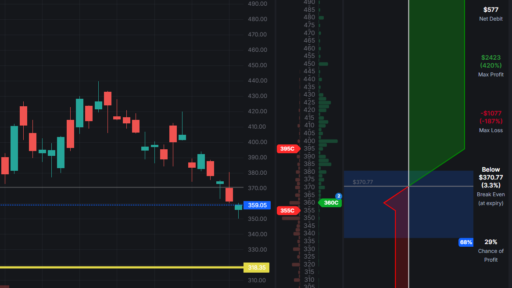
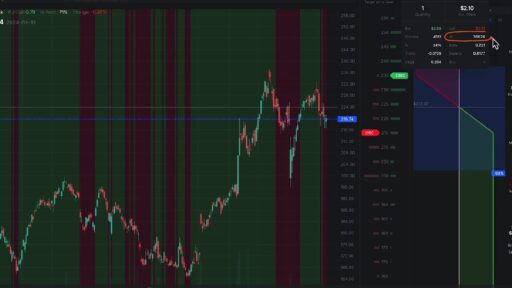
At the core of our prediction was the call wall at $25. A quick glance at the open interest (OI) revealed a staggering 21,000 call options set for that week. To put this in perspective, those options control approximately 2.1 million shares of Palantir. The implications are significant: when a large number of traders bet on a stock’s rise, it creates a resistance level that can be challenging for the stock to breach.
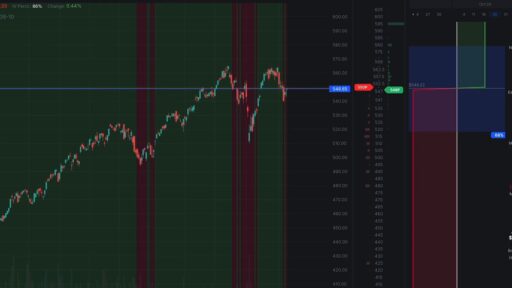
But that wasn’t all. Looking ahead to the following week, we noted an even larger call wall at the same $25 level, with 68,000 options translating to 6.8 million shares of SoFi (a similar stock). Combined, that means about 9 million shares were effectively “guarding” the $25 mark. This substantial volume creates a formidable resistance point, which we could visualize by marking it on our charts.
Intraday Movement: A Closer Look
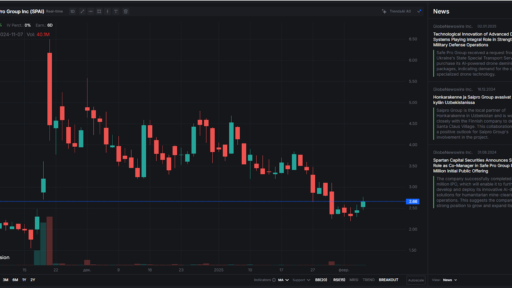
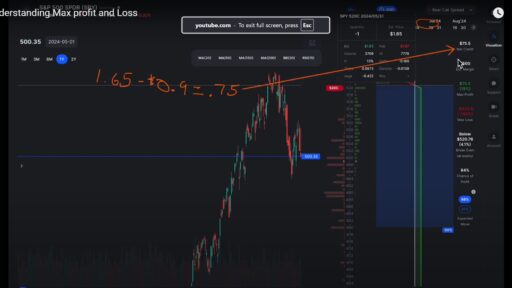
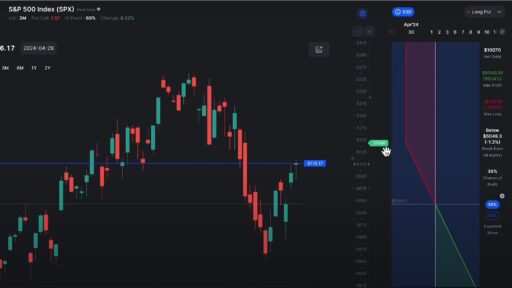
To better understand the stock’s behavior, let’s break down the five-minute chart from the day of the earnings report.
- Start of the Day: The red line indicating our $25 call wall comes into play as we approach the morning peak.
- First Hit: As the stock hits $25, we immediately see sell-off pressure, evidenced by a series of red bars indicating strong selling volume.
- Subsequent Attempts: Each time the stock attempts to breach the $25 mark, it experiences a similar pattern: a brief rise followed by selling pressure. Even positive news and analyst upgrades couldn’t keep the stock above $25 for long.
By the end of the trading day, despite an initial strong surge indicated by a significant green candle, the stock ultimately closed below the call wall, illustrating the power of this resistance.
The Mechanics Behind Call Walls
You might wonder why these call walls create such pronounced effects on stock prices. Here’s a simplified breakdown:
- Buying Call Options: When you buy a call option on a stock like Palantir, you’re expressing a bullish sentiment. However, the market maker who sold you that call is now exposed to bearish risk, holding a negative position.
- Market Maker Hedging: To mitigate this risk, market makers typically buy shares of the underlying stock, effectively hedging their position. If the stock price starts to rise and you begin to sell your call options for profit, they may sell shares to balance their exposure.
- Selling Pressure: This selling can create downward pressure on the stock price, especially when combined with the substantial volume of options at the same strike price.
Conclusion: Harnessing the Power of Call Walls
Understanding call walls can give traders a crucial edge, especially with highly liquid stocks. While these indicators are not foolproof, they serve as valuable tools for anticipating price movements and making informed decisions.
If you’re interested in harnessing the power of options data for your trading strategies, platforms like OptionsWatch.io offer premium features that include call wall indicators. They even provide a 30-day free trial, allowing you to explore this powerful tool without any risk.
In summary, call walls offer a fascinating glimpse into market dynamics. By recognizing these patterns, you can enhance your trading strategy and potentially improve your investment outcomes. Happy trading!