
In the world of options trading, understanding call and put walls is essential. These tools can greatly enhance your trading strategy and improve your decision-making process. Let’s explore their significance and how to effectively utilize them.
What Are Call and Put Walls?
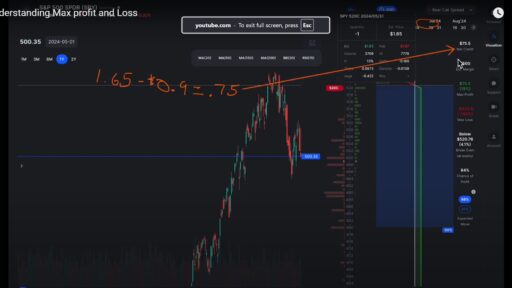
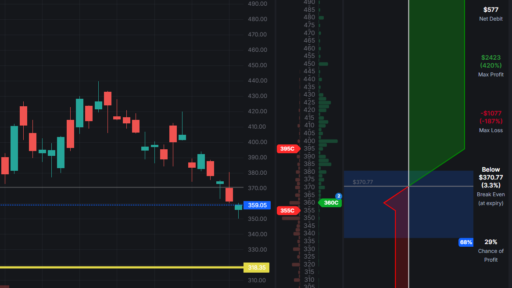
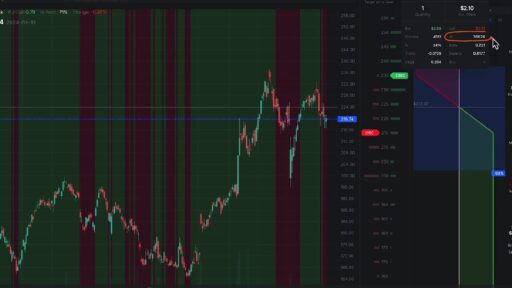
Call walls (represented by green bars) and put walls (shown as red bars) indicate levels of significant interest among options traders. These walls help traders identify potential support and resistance levels for stocks, making them invaluable in crafting your trading strategies.
Why Choose Liquid Stocks?
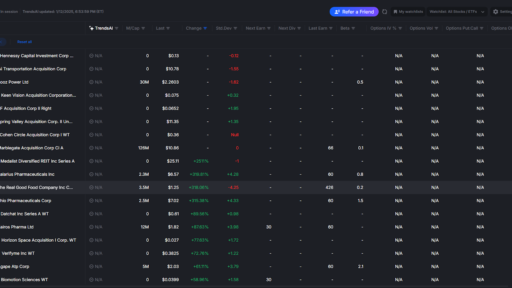
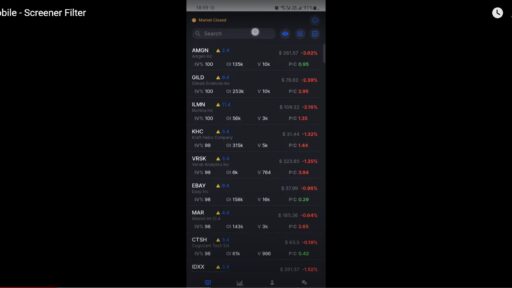
When analyzing options, focus on liquid stocks—those that have high trading volumes, like Apple (AAPL). Liquidity means there are many participants in the market, making it easier to enter and exit trades.
Exploring Call Walls
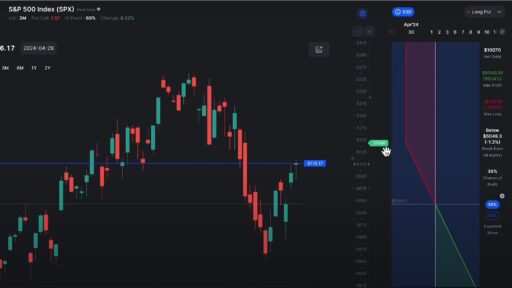
To illustrate how to use call walls effectively, let’s take a closer look at Apple’s options for the third Friday of the month, a date typically associated with high liquidity.
- Identify Resistance Levels:
Using the visualizer, we see significant call walls at $235 and $230. These levels indicate where many traders are betting that the stock will struggle to rise above, acting as potential resistance points. - Open Interest and Volume:
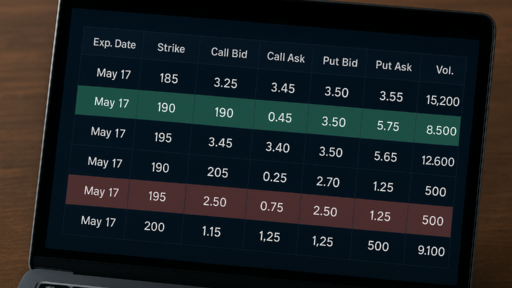
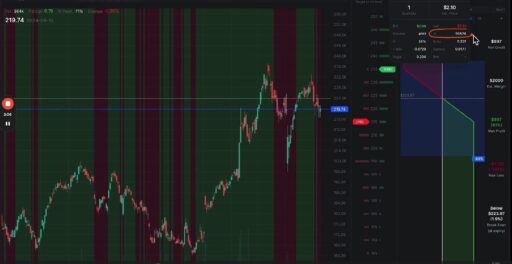
- Open Interest: This metric reflects the total number of options contracts currently outstanding. For instance, Apple’s $235 call option has an impressive open interest of 39,826 contracts. A high open interest signals strong market participation at that price level.
- Volume: This indicates how many contracts have been traded during the day. For Apple, today’s volume on the $230 call suggests it is a hot spot for traders, indicating where the most action is happening.
Using Call Walls in Your Strategy
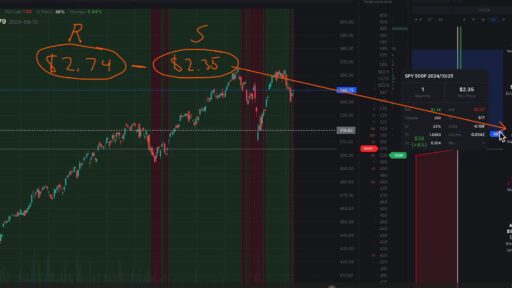
When setting up trades like a bear call spread, these resistance levels can guide you. Choose strike prices around these walls to maximize your chances of success, ensuring you are aware of the potential price points where the stock might struggle.
Analyzing Put Walls
Now let’s shift our focus to the put walls, which indicate support levels.
- Identify Support Levels:
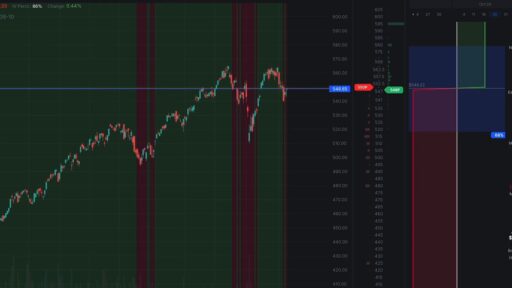
For Apple, major put walls appear at $210 and $200. These levels are where traders expect the stock to find buying interest and could bounce back. - Liquidity Insights:
The larger the put wall, the more confidence you can have in these levels holding up. For example, the presence of significant open interest at these levels suggests strong backing from traders.
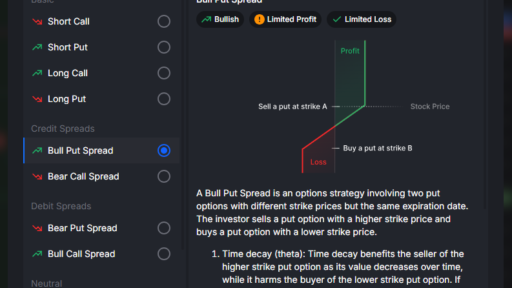
Strategies for Put Walls
If you’re considering a bull put spread, opt for strike prices that coincide with these robust support levels. This strategy aims to take advantage of the stock price bouncing back off these supports, enhancing your probability of success.
Case Study: Broadcom (AVGO)
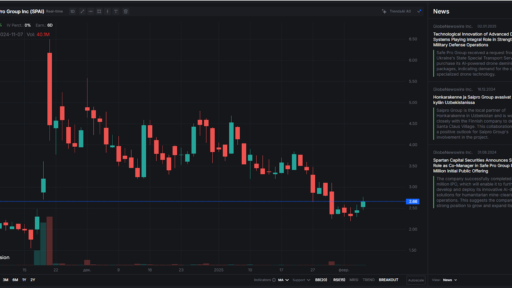
To further illustrate these concepts, let’s look at Broadcom (AVGO), a stock that’s a bit less liquid than Apple.
- Analyze the Walls:
Upon checking AVGO’s options for the same expiration date, you’ll notice stronger call walls around the $150 strike. However, the put walls are not as pronounced, indicating less support below the current trading price. - Identify Trading Opportunities:
For traders looking to establish a bear call spread, the solid call wall levels at AVGO can guide your strike price selection, as these levels indicate where the stock may face resistance.
Conclusion
Understanding call and put walls is crucial for any options trader. These walls provide insight into market sentiment and potential price action, helping you identify strategic entry and exit points. By focusing on liquid stocks and leveraging these walls, you can enhance your trading strategies significantly.