In the world of financial markets, technical analysis is a powerful tool used by traders to make informed decisions. When it comes to option trading, understanding how to apply technical analysis can greatly enhance your ability to predict price movements, choose the right strategies, and ultimately achieve success in the markets.
This article will walk you through the fundamentals of technical analysis, how to use it effectively in options trading, and the essential tools and indicators that can help you make profitable trades. Whether you’re a beginner or an experienced trader, understanding the relationship between technical analysis and options trading can give you a competitive edge.
What is Technical Analysis?
Technical analysis involves the study of historical price data, volume, and market trends to forecast future price movements. Unlike fundamental analysis, which focuses on the underlying value of assets, technical analysis is purely concerned with price patterns, chart formations, and indicators to predict future market activity.
In options trading, technical analysis plays an essential role because it helps traders assess the right time to enter or exit trades based on price movement trends. By analyzing price charts, you can make more precise predictions about the direction of the underlying asset, which is crucial for deciding whether to buy or sell calls and puts.
Key Components of Technical Analysis for Option Trading
There are several key components to technical analysis that traders use to inform their decisions. Let’s explore some of the most common and useful ones for options trading:
1. Price Charts
Price charts are the foundation of technical analysis. The most commonly used chart types in options trading are:
- Line Charts: These charts plot the closing prices of an asset over time, giving a simple view of the price direction.
- Bar Charts: These charts display the opening, closing, highest, and lowest prices during a given period, providing more detailed information than line charts.
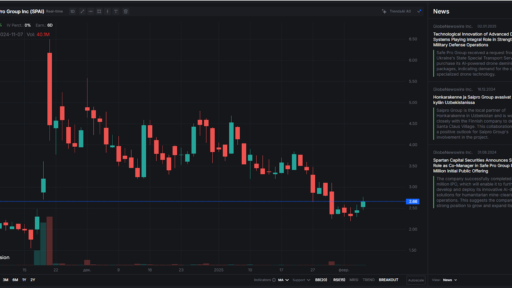
- Candlestick Charts: Candlestick charts are similar to bar charts but visually easier to interpret, showing the open, high, low, and close in a single candlestick. They are popular because they provide more insight into market sentiment.
When trading options, it’s essential to observe the patterns that form on these charts. For example, rising or falling trends often indicate the underlying asset’s price movement, which can impact the value of the options you are trading.
2. Support and Resistance Levels
Support and resistance are fundamental concepts in technical analysis. These levels represent price points where an asset has historically had difficulty moving beyond.
- Support: This is the price level at which a downtrend is expected to pause due to a concentration of buying interest.
- Resistance: This is the price level at which an uptrend is expected to pause due to a concentration of selling interest.
Identifying support and resistance levels helps options traders understand where an asset’s price might reverse, offering opportunities to trade options more effectively. For instance, if the price of a stock is approaching a strong support level, it could be a signal to buy a call option if you believe the price will bounce back up.
3. Moving Averages
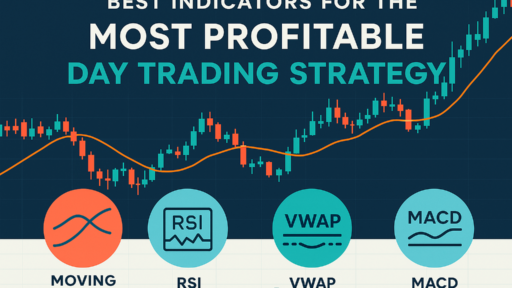
Moving averages are one of the most widely used technical indicators in option trading. A moving average smooths out price data over a specific time period to create a trend-following indicator.
- Simple Moving Average (SMA): The average price of an asset over a specified period (e.g., 50-day or 200-day). It is useful for identifying the overall trend.
- Exponential Moving Average (EMA): Similar to the SMA but gives more weight to recent prices, making it more sensitive to recent price movements.
In option trading, moving averages help identify the prevailing trend. If the price is above the moving average, it may indicate an upward trend, suggesting buying calls. Conversely, if the price is below the moving average, it could signal a downtrend, suggesting a potential for buying puts.
4. Relative Strength Index (RSI)
The Relative Strength Index (RSI) is a momentum oscillator that measures the speed and change of price movements. The RSI ranges from 0 to 100, and it is commonly used to identify overbought or oversold conditions.
- Overbought: When the RSI is above 70, it indicates that the asset may be overbought and could be due for a price correction.
- Oversold: When the RSI is below 30, it suggests the asset may be oversold and could be ready for a price rebound.
RSI can be used in option trading to help you determine entry points. For example, if the RSI shows that a stock is oversold, you may choose to buy a call option, expecting a price increase.
5. Volume
Volume refers to the number of shares or contracts traded during a specific time period. High volume can indicate strong interest in an asset, while low volume may suggest a lack of conviction in the market.
Volume analysis helps options traders confirm price movements. For instance, if a stock’s price rises along with increasing volume, it could be a strong indicator of a bullish trend, and buying a call option might be a good move.

How to Apply Technical Analysis in Option Trading
Now that we’ve covered some key tools and indicators of technical analysis, let’s discuss how to apply these in option trading:
1. Identify the Trend
The first step in using technical analysis is identifying the trend of the underlying asset. A strong uptrend or downtrend is crucial for successful options trading, as it provides the foundation for making informed predictions about future price movements.
- Uptrend: If the underlying asset is in an uptrend, consider buying call options. The trend suggests that the price will likely continue to rise.
- Downtrend: If the underlying asset is in a downtrend, consider buying put options. The price is expected to continue declining.
Using moving averages and trendlines is an effective way to identify the trend. Once you’ve established the trend, you can apply other technical indicators, such as RSI and volume, to further confirm your analysis.
2. Monitor Support and Resistance
Support and resistance levels are vital for timing your entries and exits in options trading. Watch for the price to test these levels and use them as clues for placing trades.
- If the price approaches support and shows signs of bouncing back, you may buy a call option.
- If the price tests resistance and begins to fall, buying a put option could be a good strategy.
Support and resistance help you determine price targets, which are essential for setting profit and loss limits in your options trades.
3. Use RSI to Confirm Overbought/Oversold Conditions
RSI is an excellent tool to help you determine when to enter or exit a trade based on market conditions.
- Overbought: If the RSI indicates that an asset is overbought, it could signal that the asset is due for a price correction. In this case, you might consider buying a put option to take advantage of the potential price drop.
- Oversold: If the RSI shows that an asset is oversold, it may be a good time to buy a call option, expecting a price increase.
Using RSI in combination with other indicators can significantly improve your chances of successful options trading.
4. Analyze Volume for Confirmation
Volume is a crucial indicator in confirming the strength of a price move. Higher volume during price increases suggests that the uptrend is strong, making call options a favorable choice. On the other hand, higher volume during price decreases can confirm a bearish trend, signaling the potential for profitable put options.
Conclusion: The Power of Technical Analysis in Options Trading
Technical analysis is an essential skill for any options trader. By mastering the key tools and indicators—such as price charts, support and resistance levels, moving averages, RSI, and volume—you can make more informed, data-driven decisions. Understanding these concepts helps you identify trends, entry points, and potential risks, all of which are crucial for successful option trading.
While no method is foolproof, incorporating technical analysis into your trading strategy can significantly improve your chances of success. As with all trading, it’s important to combine technical analysis with a well-thought-out risk management plan to protect your capital and maximize your profits.
FAQ: Technical Analysis in Option Trading
Q1: What is the best technical indicator for options trading?
A1: There is no single best indicator, as each one has its strengths. However, popular indicators like Moving Averages, RSI, and Volume are widely used by options traders to confirm trends and identify overbought/oversold conditions.
Q2: Can technical analysis be used for all types of options?
A2: Yes, technical analysis can be applied to all types of options (calls and puts) and underlying assets (stocks, commodities, etc.). It helps you understand market sentiment and price movements, making it useful for both short-term and long-term options strategies.
Q3: How do I know when to exit an options trade using technical analysis?
A3: Exiting a trade can be determined by various factors such as hitting a resistance level, when an RSI indicates an overbought/oversold condition, or when your target price has been reached. Always set a predefined exit strategy to manage risk effectively.
Q4: Is technical analysis enough for successful options trading?
A4: While technical analysis is an essential tool, it’s important to combine it with other methods, such as understanding market fundamentals and having a solid risk management strategy. The combination of these factors increases your chances of success.


