In trading and investing, it is vital to understand price trends. Simple Moving Averages in trading are a key tool in this regard. These averages help in making informed decisions by providing a clearer view of market trends. Among the most common tools used to identify these trends is the Simple Moving Average (SMA). Consequently, the SMA can greatly enhance your trading strategy. Moreover, it benefits both novice and experienced traders. In this article, let’s dive into what the SMA is, how it works, and why it is important for traders.
What is a Simple Moving Average (SMA)?
A Simple Moving Average (SMA) is a technical analysis tool. It calculates the average price of a security over a set number of days. Specifically, this could be 20, 50, 150, or even 200 days, depending on the time frame a trader is analyzing. While daily price swings tend to blur market trends, Simple Moving Averages in trading cut through this noise and reveal broader patterns. For novice traders, grasping SMAs unlocks the fundamentals of technical analysis. These tools smooth out volatility, thus offering a clearer picture of market direction. Ultimately, mastering SMAs establishes a solid foundation for analyzing financial markets.
Furthermore, daily price swings create market noise. To address this, a 20-day Simple Moving Average cuts through the chaos, smoothing out fluctuations. Traders, therefore, use this sleek line on charts to spot trends with greater clarity. As a result, it’s a powerful tool that transforms volatile data into actionable insights. Essentially, the SMA averages recent prices and shows market trends, which in turn guides better trades.
How Does It Work?
To understand how SMA works, let’s take a closer look at the process:
Calculation: Suppose you want to calculate a 20-day SMA. You would first add up the closing prices of a stock for the past 20 days and then divide that sum by 20. This calculation is updated daily. As each new day adds its closing price, it lowers the price of the oldest day. Consequently, this creates a moving line on a chart that represents the average price over time.
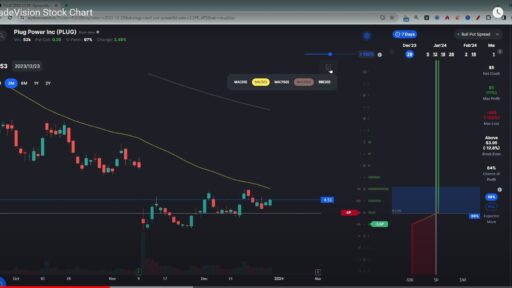
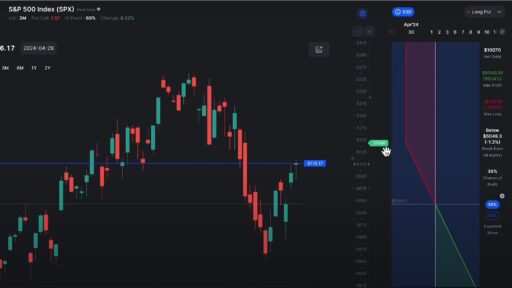
Visual Representation: On a price chart, the SMA is plotted as a continuous line. Notably, the SMA line shifts with daily price fluctuations, thus revealing market trends. Short periods, such as 20 days, capture recent changes and brief trends. Conversely, longer spans, such as 200 days, smooth out data, highlighting enduring patterns. This flexible tool is useful for both short- and long-term trading. Traders often use different SMAs together to help them spot market shifts and make informed decisions.
Comparison: Shorter period SMAs, like the 20-day SMA, react quickly to recent changes in price and can assist traders in spotting emerging trends. On the other hand, long-term SMAs, spanning 150 or 200 days, reveal enduring market trends. These indicators cut through daily noise, offering a clear view of overarching movements. Consequently, they help traders focus on the bigger picture by reducing short-term volatility and avoiding distractions from minor price swings.
Why is it Important?
Simple Moving Averages in trading are crucial for traders and investors. They play a significant role in identifying a market’s trend direction. By understanding the importance of SMAs, you can greatly improve trading decisions and risk management.
Trend Identification: One of the primary uses of SMA is to identify trends. If the current price of a security is above its SMA, it is often seen as a sign of an uptrend. Traders may interpret this as a signal to hold onto their position or even buy more. Conversely, if the price is below the SMA, it may indicate a downtrend. In this case, it might be time to sell or avoid buying.
Support and Resistance: Additionally, SMAs can act as dynamic support and resistance levels. For instance, a 200-day SMA might serve as a strong support level in a long-term uptrend. Prices often tend to bounce off the SMA line. If the price stays above this line, it could signal the strength of the uptrend. Conversely, if prices break below the SMA, it might indicate a potential reversal or weakening of the trend. By combining SMAs with indicators like Bollinger Bands, you can gain valuable trading insights. This blend enhances market analysis and improves your understanding of price movements and entry points.
Signal Generation: Moreover, crossovers between short and long SMAs can signal buying or selling opportunities. A “golden cross” occurs when a 50-day SMA crosses above a 200-day SMA. Many traders view this as a bullish signal, suggesting that the market might be shifting to an uptrend. Conversely, a “death cross,” where a shorter SMA crosses below a longer SMA, can signal a bearish trend.
In conclusion, the Simple Moving Average is a powerful tool in a trader’s arsenal. SMAs show market trends by smoothing price changes. Consequently, they help traders make better choices. From quick 20-day snapshots to 200-day views, these tools reveal key market trends. By pairing SMAs with other indicators, you can sharpen predictions and bolster risk management. Mastering this technique will elevate your trading strategies and offer deeper market insights. Both short-term traders and long-term investors will benefit from SMAs, as they provide a clear signal amidst market noise. As traders improve, using SMAs with broader analysis will unlock a deeper market understanding. Advanced tutorials can further showcase SMAs’ full potential in comprehensive trading approaches.


