If you’re looking to maximize your trading strategy using options, understanding how to effectively use an options watch list is crucial. This guide will help you navigate the key features of the watch list filter, making it easier to find profitable opportunities.
Understanding the Options Watch List
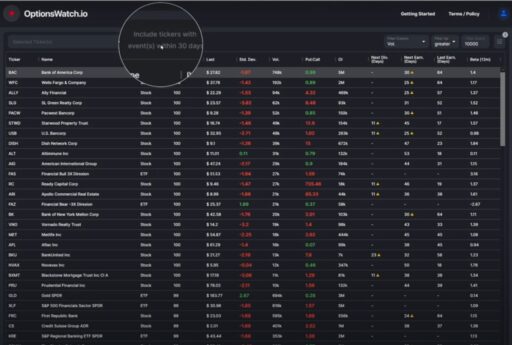
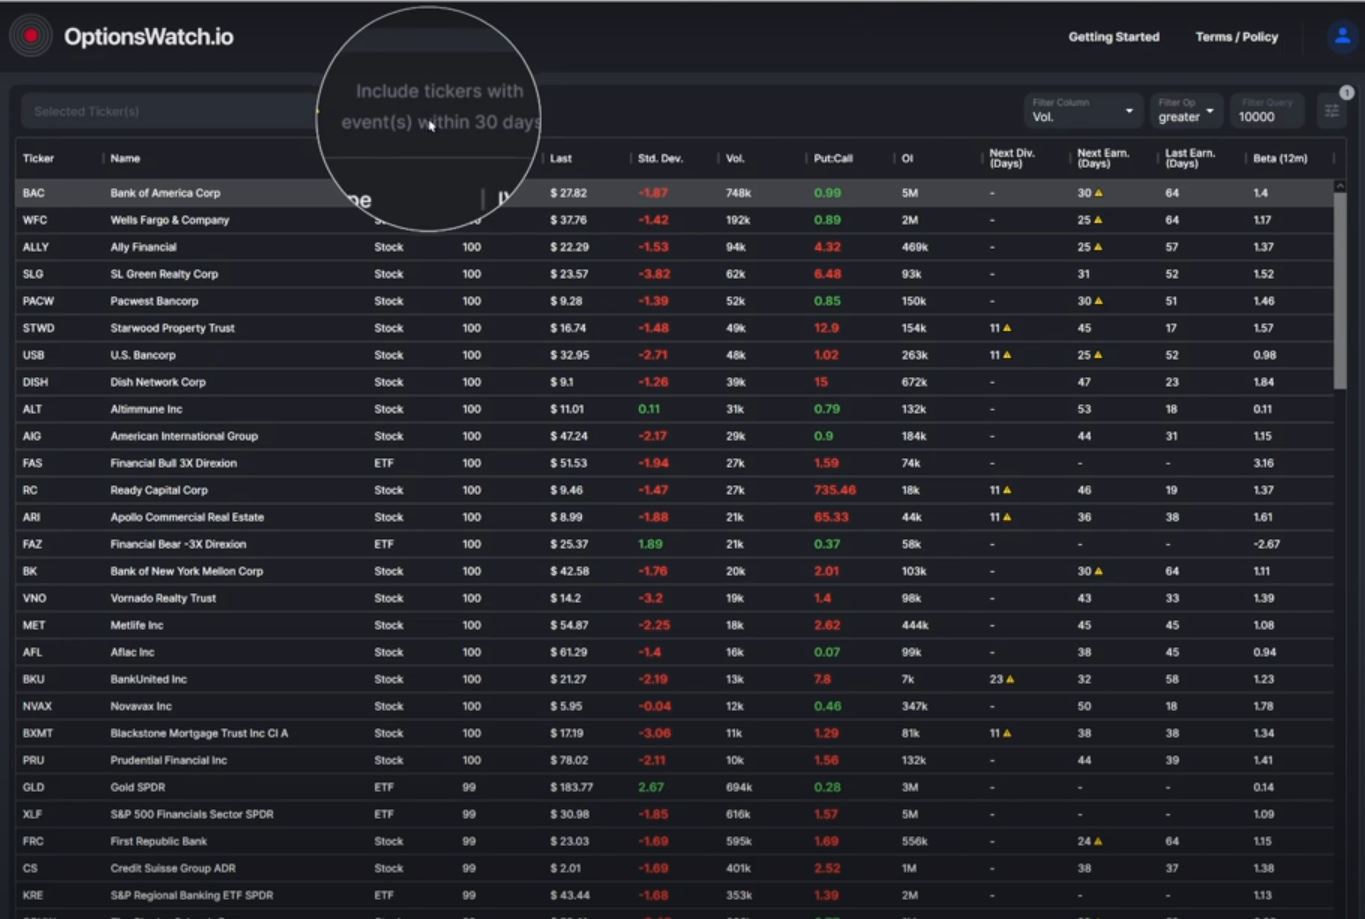
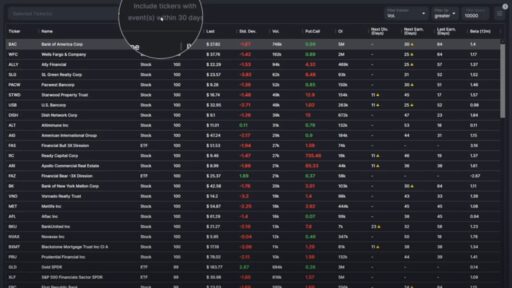
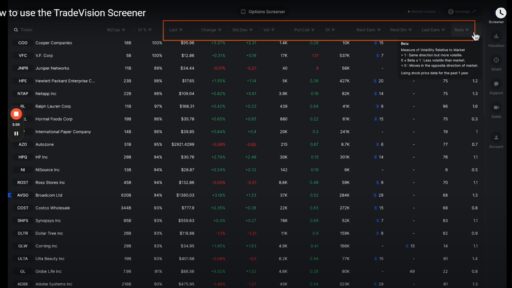
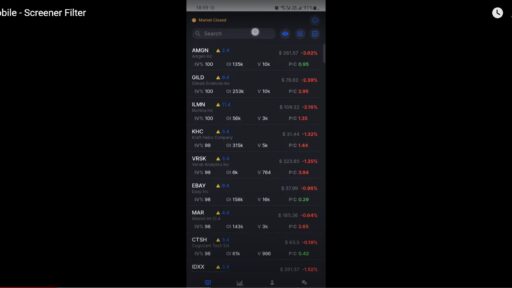
The options watch list is a powerful tool that provides valuable insights into various stocks and ETFs. Here’s a breakdown of the key components you’ll encounter:
Key Metrics to Consider
- Implied Volatility (IV) Percent: This metric indicates market expectations of volatility. Higher IV can lead to higher option premiums, which can be beneficial for sellers.
- Last Price: The most recent trading price of the stock, giving you a snapshot of its current market value.
- Standard Deviation: This shows how much the stock’s price is expected to fluctuate over a given time period. A higher standard deviation suggests greater volatility.
- Volume and Open Interest: Volume indicates the number of contracts traded in a day, while open interest shows the total number of outstanding contracts. High open interest typically means more liquidity.
- Upcoming Events: This includes dividend and earnings events. Knowing when these occur (e.g., 11 days away for dividends) can significantly influence your trading decisions. You can filter stocks to exclude those with events in the next 30 days if you prefer a more stable trading environment.
Setting Filters
You have the flexibility to customize your watch list. For instance, if you want to focus only on stocks with open interest greater than 10,000 contracts, you can easily set that filter. This allows you to narrow down your options to about 1,885 stocks and ETFs, giving you a manageable selection to analyze.
Analyzing Individual Stocks
Once you have your filtered list, clicking on any ticker provides a wealth of information:
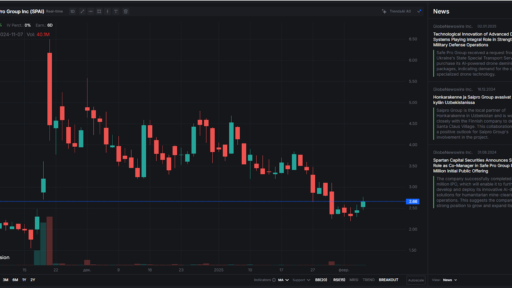
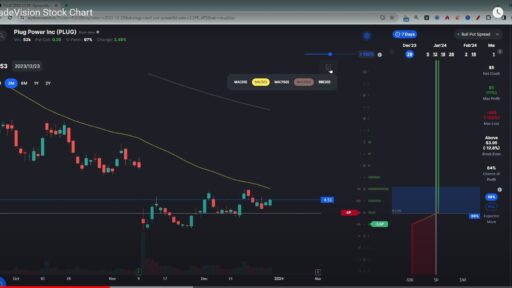
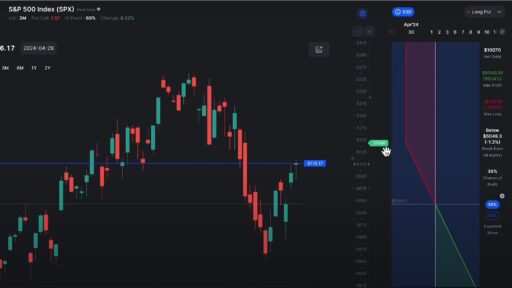
- Stock Chart: Visualize the stock’s performance over different time frames (e.g., six months, one year).
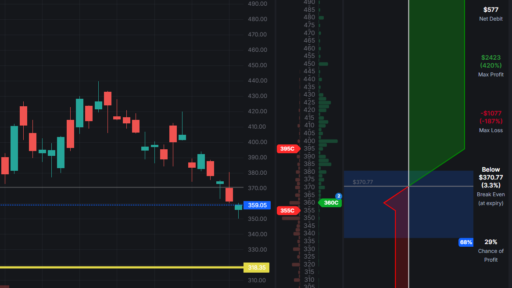
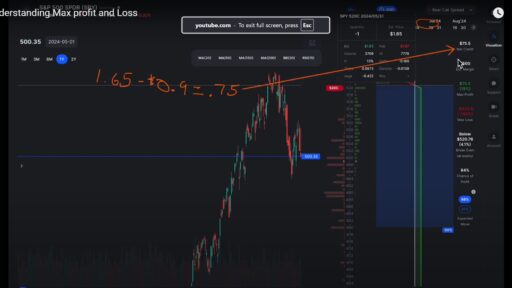
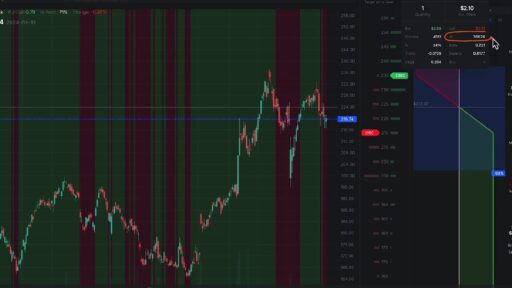
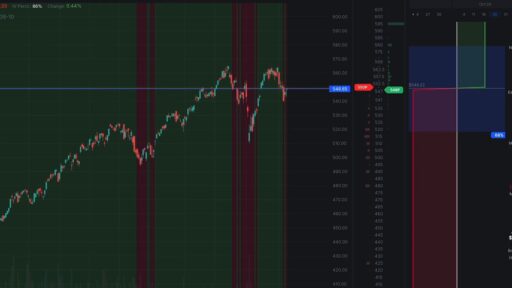
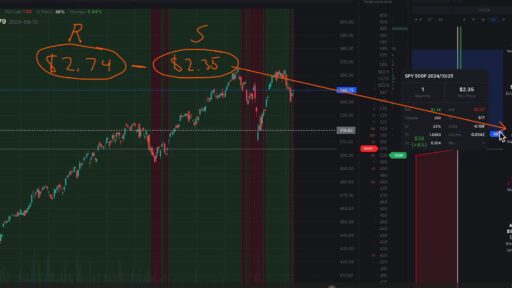
- Profit and Loss Chart: This feature is particularly useful for strategy visualization. For example, if you’re considering an Iron Condor strategy, you can see your break-even points and profit zones directly on the chart.
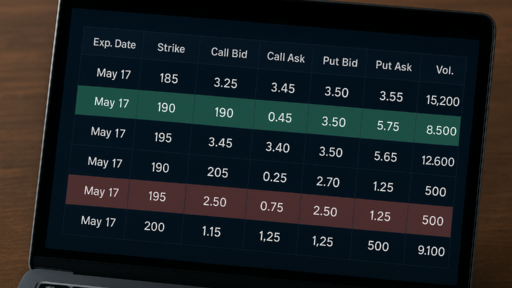
- Expiration Dates: Adjust the expiration dates to evaluate potential outcomes. For instance, shifting to a 41-day expiration might show a 38% potential profit, helping you gauge whether that aligns with your risk appetite.
Comprehensive Data at Your Fingertips
In one screen, you can access critical data such as:
- Chance of Profit: Understand the likelihood of your trade being profitable.
- Maximum Loss and Gain: Know the risks involved before executing trades.
- Greeks Analysis: Dive deep into the options pricing with detailed metrics (delta, theta, gamma, vega, and rho) for each leg of your strategy.
Utilizing Additional Indicators
To enhance your analysis, the platform also offers indicators like moving averages and Bollinger Bands. These can provide further context on market trends and help refine your entry and exit points.
Switching Between Tickers
Once you’ve analyzed one stock, you can easily return to your filtered list and switch to another ticker, like Bank of America, by simply clicking on it. The process remains the same—analyze the chart, assess your strategy, and decide on the next steps.
Conclusion
Harnessing the power of an options watch list is essential for any serious trader. By understanding the metrics, filtering options, and analyzing individual stocks with clarity, you’ll be well on your way to making informed trading decisions. With these tools at your disposal, you can confidently enter the options market and strategize for success. Happy trading!
