Hey traders and investors! Today, we’re diving into one of the most insightful features on OptionsWatch.io—the Expected Move function. This tool is incredibly useful for visualizing potential price movements of stocks, and it’s quite straightforward to use. Let’s walk through how to leverage this feature to enhance your trading strategies.
Getting Started with Expected Move
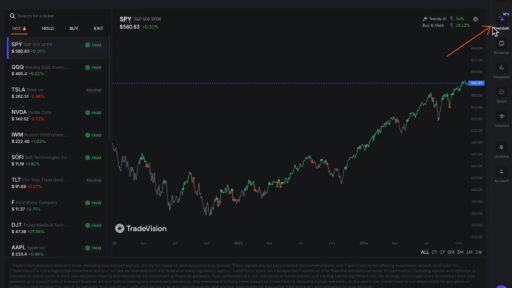
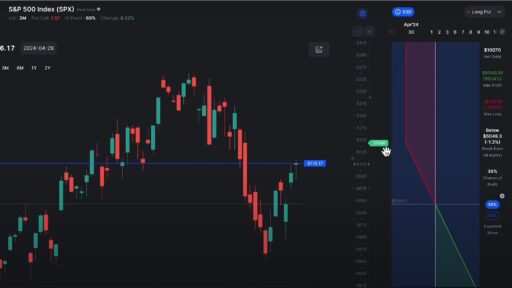
To begin using the Expected Move feature, head over to OptionsWatch.io and locate the search bar in the upper left-hand corner. Type in the stock symbol you’re interested in—let’s use SPY, the ETF tracking the S&P 500 index, as our example.
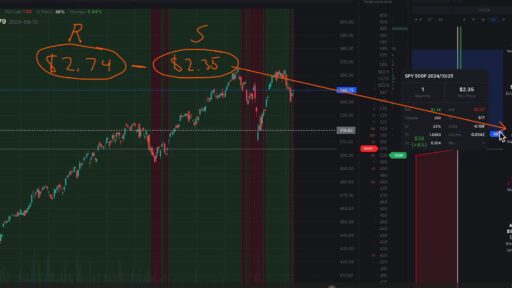
Once you’ve selected SPY, navigate to the chart where you’ll find the Expected Move information positioned in the bottom right corner. Here, you’ll see two percentiles you can choose from: 68% and 85%.
Understanding the Expected Move
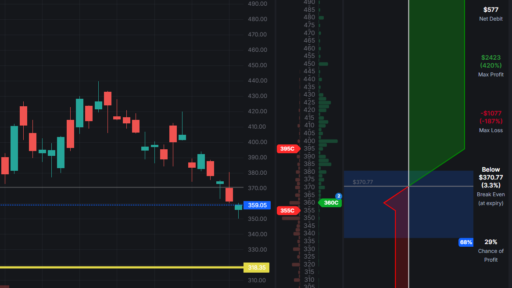
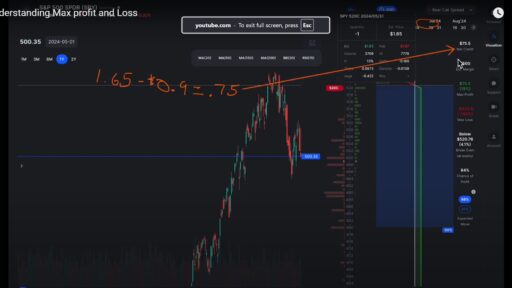
The Expected Move function provides an estimate of how much the price of the underlying stock (SPY in this case) might move by a specific expiration date. This is crucial for setting up trades and managing your risk. The feature visualizes the potential price range of SPY by drawing a blue rectangle on the chart.
Example with SPY
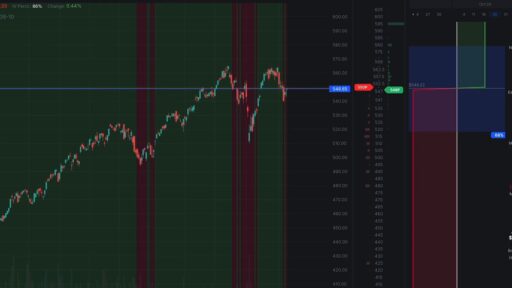
Let’s say we have an expiration date of April 29th, which is just 2.8 days away. Using the 68% Expected Move, the blue rectangle will show you the range within which SPY is likely to trade. For this example, the expected range might be between approximately $505 and $511. This means there is a 68% chance that SPY’s price will fall within this range by April 29th.
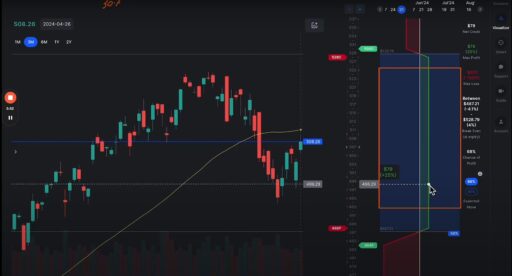
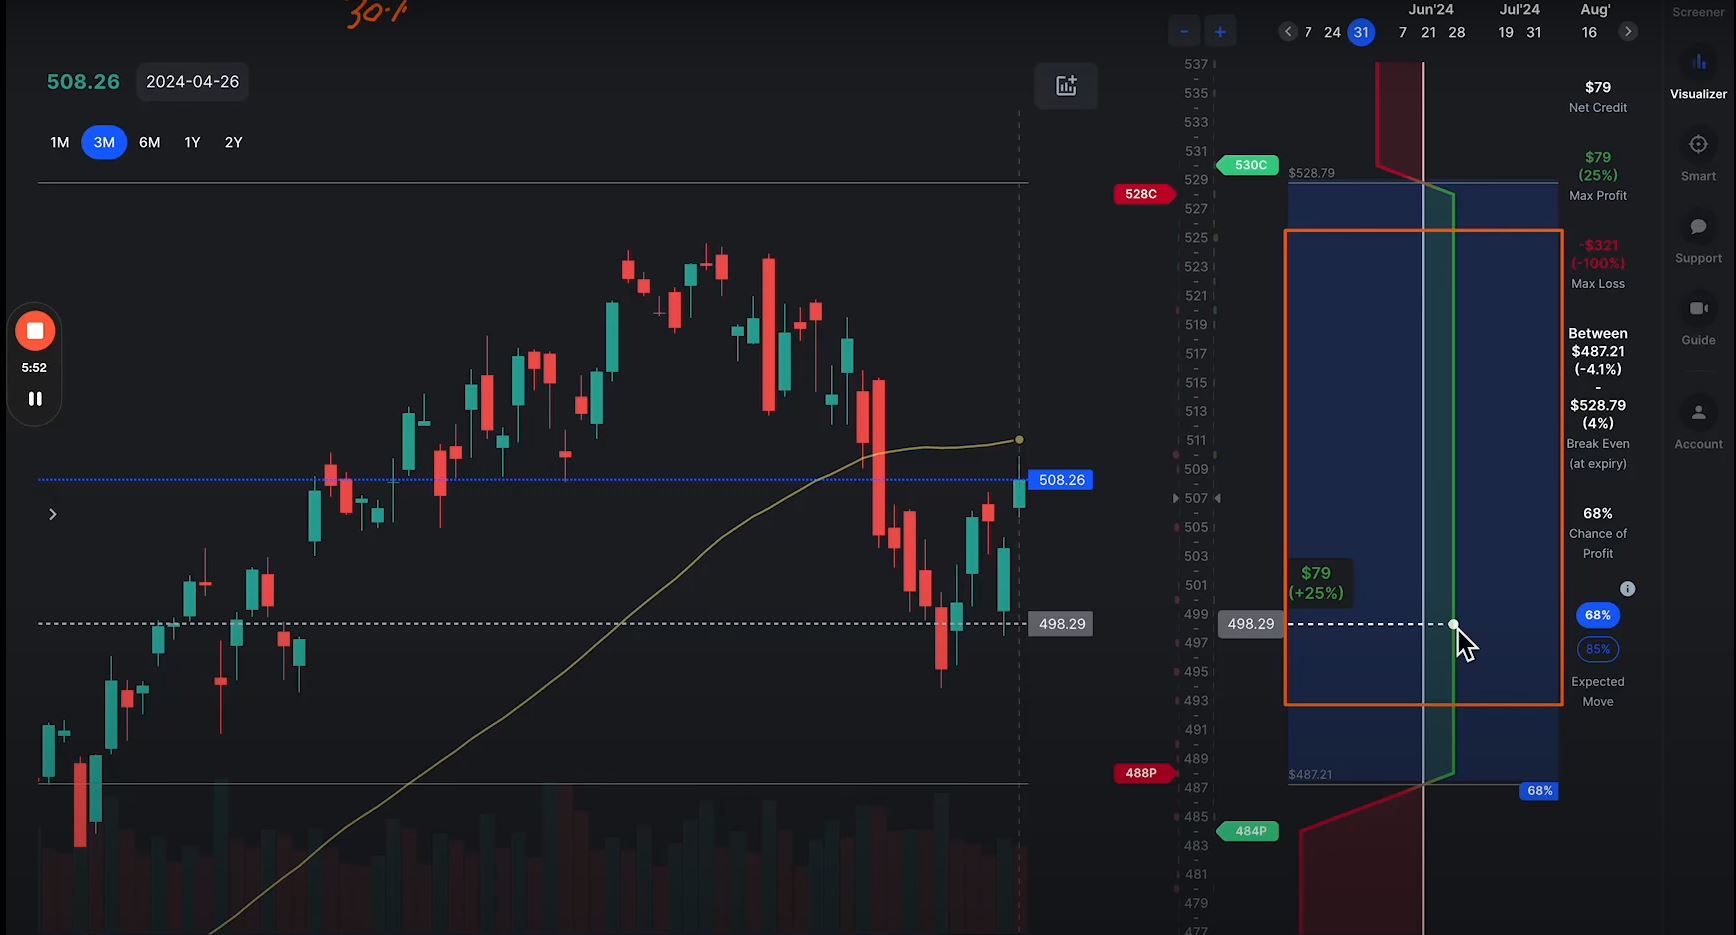
If you extend the expiration date to 35 days out, like May 31st, you’ll notice the blue rectangle widens significantly. This is because the longer timeframe allows for greater price fluctuations. For a 68% Expected Move, the range could expand from around $489 to $529. The wider range reflects the increased potential for price movement over a longer period.

Utilizing Expected Move for Trading
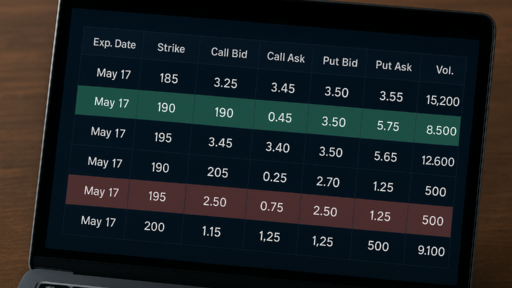
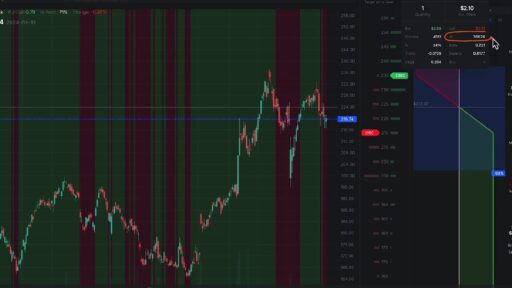
The Expected Move tool is invaluable for various trading strategies. For instance, if you’re planning a bullish trade, you can align your target price within the range of the blue rectangle to set realistic profit margins. Alternatively, if you’re considering a more complex strategy like an Iron Condor, you can adjust the strike prices of your options to match the Expected Move range, helping you set up trades that are better aligned with potential price movements.
The Impact of Implied Volatility
A crucial factor influencing the Expected Move is Implied Volatility (IV), which is displayed in the upper left-hand corner of the chart. Implied Volatility represents the market’s forecast of the stock’s volatility and directly affects the width of the Expected Move rectangle.
For instance, if SPY has an Implied Volatility percentile of 65%, this indicates that SPY has experienced higher volatility than 65% of the time over the past year. High IV generally leads to a larger Expected Move, reflecting increased uncertainty in future price movements. Conversely, a lower IV percentile would result in a narrower Expected Move range, suggesting greater market confidence in the stock’s price stability.
Key Takeaways
- Expected Move: Visualizes the potential price range of a stock by a given expiration date.
- Percentiles: The 68% and 85% percentiles provide different ranges of expected price movements.
- Implied Volatility: Affects the width of the Expected Move range. Higher IV typically leads to a larger range.
- Application: Use the Expected Move to align your trades with potential price movements and manage your risk effectively.
Remember, while the Expected Move provides a useful estimation based on market data, it’s essential to understand that these are implied probabilities and not certainties. The actual price of SPY could fall outside the expected range, but this tool helps you make more informed decisions by providing a probable price range based on current market conditions.