In the fast-paced investing world, staying ahead of market trends is a key to making informed decisions that lead to profitable outcomes. But how do you spot market trends? Is it about just looking at a stock chart or reading market news? In reality, spotting market trends involves a combination of tools, knowledge, and strategic foresight. In this post, we will walk you through the essential steps on how to spot market trends and use that information to your advantage, ensuring you can stay ahead of the curve in both short-term and long-term investments.
What Are Market Trends?
Before diving into how to spot market trends, it’s important to define what we mean by “market trends.” Market trends refer to the general direction in which a financial market or specific asset is moving. They can be broken down into three primary categories:
- Uptrend: A period when prices are consistently rising.
- Downtrend: A phase where prices are consistently falling.
- Sideways/Neutral Trend: A market that is neither clearly rising nor falling, but fluctuating within a range.
Each of these trends presents unique opportunities and risks. The key is to be able to identify when a market is entering a new trend, whether it’s a shift from sideways to upward, or vice versa.
How to Spot Market Trends: Tools and Techniques
When it comes to learning how to spot market trends, several tools and techniques are commonly used by professional traders and investors. These include technical analysis, fundamental analysis, and sentiment analysis. Let’s break down each of these methods in detail.
1. Technical Analysis: Charting the Path Ahead
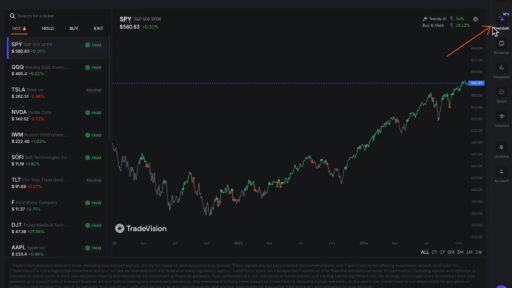
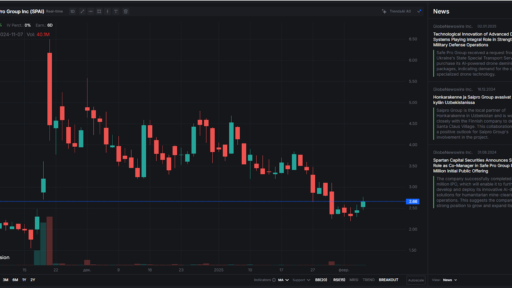
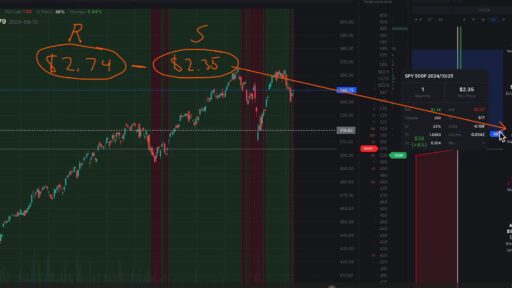
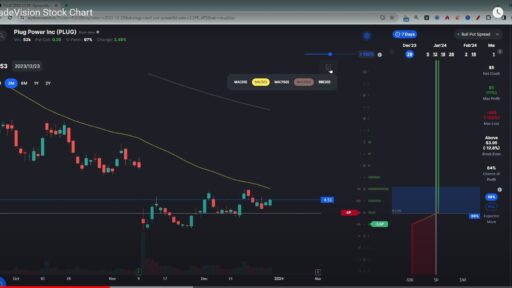
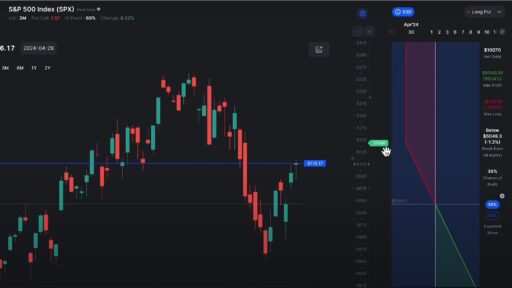
Technical analysis is one of the most powerful ways to spot market trends. This method uses historical price data, volume, and other technical indicators to predict future price movements. Chart patterns and trend lines are integral parts of technical analysis.
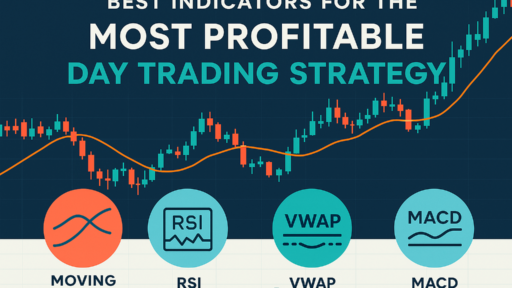
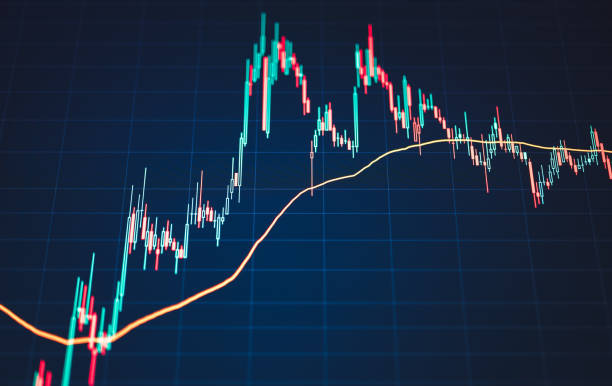
- Moving Averages: One of the most common indicators used to identify trends. The 50-day and 200-day moving averages, for example, can help smooth out daily price fluctuations to reveal underlying trends.
- Trendlines: Connecting highs or lows on a price chart helps visualize the direction of the market. A sustained break above or below a trendline may signal the beginning of a new trend.
- RSI (Relative Strength Index): This oscillator measures overbought or oversold conditions in a market. RSI values above 70 suggest overbought conditions (possible reversal), while values below 30 indicate oversold conditions.
By learning how to spot market trends with these tools, you can get a clearer picture of where the market is heading and position your investments accordingly.
2. Fundamental Analysis: Understanding the Bigger Picture
While technical analysis focuses on price and volume, fundamental analysis looks at the underlying factors that influence market prices. This includes economic indicators, company earnings, and geopolitical events.
- Economic Indicators: Key metrics like GDP growth, unemployment rates, and inflation data can give you insights into the overall market sentiment and potential trends.
- Corporate Earnings Reports: For stocks, quarterly earnings reports are a critical source of information. Strong earnings often indicate a bullish trend, while weak earnings can signal a bearish trend.
- Interest Rates: Central bank policies, such as changes in interest rates, can have a significant impact on market trends. Rising rates may signal a downturn in stock markets as borrowing costs increase.
Understanding how to spot market trends through fundamental analysis requires a solid grasp of macroeconomic forces and company-specific factors that influence stock prices.
3. Sentiment Analysis: Gauging Market Psychology
Market sentiment refers to the overall attitude or mood of investors toward a particular asset or market. Sentiment analysis uses news, social media, and other public sources to gauge how optimistic or pessimistic investors are. This can be a powerful tool in spotting emerging trends.
- News and Media: The way media covers market events can give clues to sentiment. Positive news stories about an industry or a company can lead to an uptrend, while negative news can lead to a downtrend.
- Social Media & Forums: Platforms like Twitter, Reddit, and financial blogs can be early indicators of sentiment shifts. When large numbers of retail investors start discussing a stock or sector, it may signal an emerging trend.
- Surveys and Polls: Investor sentiment surveys, such as the AAII Sentiment Survey, provide insights into how individual investors are feeling about the market.
Sentiment analysis often leads to early detection of market trends before they show up in the data. Understanding how to spot market trends through sentiment can give you a psychological edge over other traders.

Key Indicators for Spotting Market Trends
There are several leading and lagging indicators that traders use to confirm market trends.
- Volume: A rise in trading volume often precedes price movement. A price increase accompanied by rising volume is a strong signal of an uptrend.
- Bollinger Bands: These are used to measure volatility. When the market price moves outside of the bands, it may signal the beginning of a new trend.
- MACD (Moving Average Convergence Divergence): A versatile indicator that shows the relationship between two moving averages and can signal trend reversals.
Using a combination of these indicators will help you understand how to spot market trends more accurately.
Timeframes: Short-Term vs Long-Term Trends
One crucial aspect of trendspotting is understanding the timeframe. Market trends can vary greatly depending on the duration. Here’s a look at the difference between short-term and long-term trends:
- Short-Term Trends: These trends typically last anywhere from a few days to a few weeks. They are often driven by news events or short-term shifts in investor sentiment.
- Long-Term Trends: These can last months or years and are typically driven by more fundamental factors, such as economic cycles, industry shifts, or technological advancements.
Knowing how to spot market trends in both the short-term and long-term is crucial for making investment decisions that align with your goals.
Practical Tips for Spotting Market Trends
While using tools and techniques to spot market trends is essential, there are a few practical tips to enhance your trendspotting abilities:
- Stay Informed: Read financial news, watch market analysts, and keep track of major economic reports to understand what’s moving the market.
- Diversify Your Sources: Use multiple sources of information, including technical, fundamental, and sentiment analysis, to get a well-rounded view of market conditions.
- Patience is Key: Spotting trends takes time and experience. Don’t rush into making decisions based on short-term fluctuations.
By combining different tools and methods, you can increase your ability to identify market trends and make better investment decisions.

Conclusion
Learning how to spot market trends is a crucial skill for investors looking to maximize profits and minimize risks. Whether you’re using technical analysis, fundamental analysis, or sentiment analysis, each approach offers valuaz`ble insights into the market. By combining these techniques, staying informed, and remaining patient, you’ll be better equipped to navigate the complexities of market movements. With practice and dedication, you’ll be able to stay ahead of the curve and make smarter, more strategic investment decisions.


