Options trading isn’t just booming—it’s trending. Whether you’re scrolling through TikTok finance gurus or watching $TSLA options explode in real time, you’ve likely come across the term “options chain.” And if your first thought was, What is this alphabet soup of numbers?, you’re not alone.
Reading an options chain can feel intimidating at first glance. It’s a grid of prices, expiration dates, and Greek letters that look more like a math final than a tool for building wealth. But once you break it down, it’s actually one of the most powerful resources a trader can use.
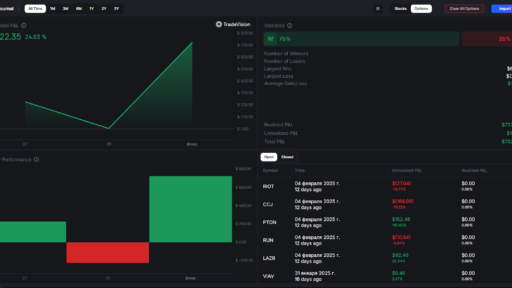
And with platforms like TradeVision making it easier than ever to view real-time chains with clean, beginner-friendly visuals, understanding your next move is finally within reach.
Let’s dive into how to read options chain data like a confident, modern trader.
How to Read Options Chain: Understand the Core Layout
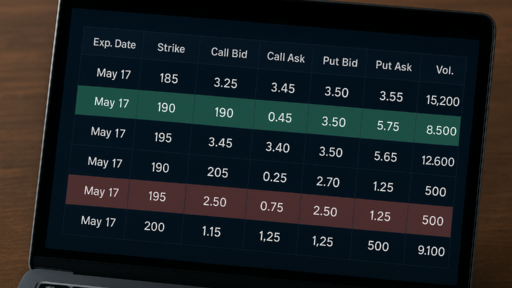
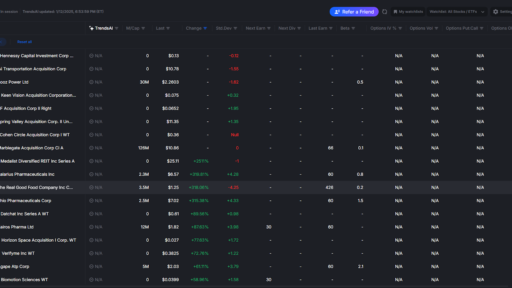
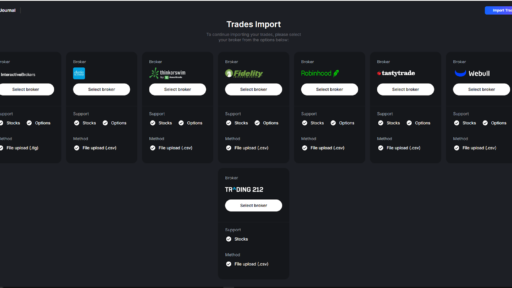
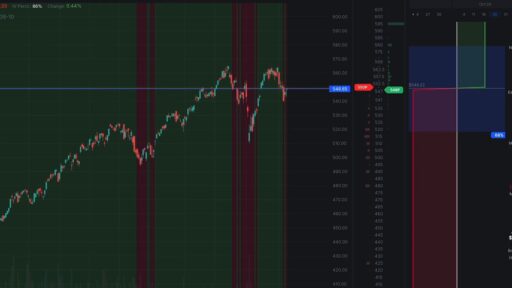
Pull up any options trading platform—like TradeVision, Robinhood, Thinkorswim, or E*TRADE—and you’ll find an options chain that looks like a table. It typically splits into two sections: Calls on the left and Puts on the right, organized by strike price in the center.
Here’s what that looks like at a glance:
| Exp. Date | Strike | Call Bid | Call Ask | Put Bid | Put Ask | Vol. | OI |
|---|---|---|---|---|---|---|---|
| May 17 | 185 | $3.25 | $3.45 | $3.50 | $3.75 | 4,800 | 15,200 |
Let’s decode this grid:
- Call Options: The right to buy the stock at a specific strike price.
- Put Options: The right to sell the stock at a specific strike price.
- Strike Price: The agreed price at which the underlying stock can be bought/sold.
- Expiration Date: The date the option contract expires.
- Bid/Ask: The highest price a buyer will pay (bid) and the lowest price a seller will accept (ask).
- Volume (Vol): How many contracts traded today.
- Open Interest (OI): Total contracts still open and active.
It’s like scanning an Amazon product comparison chart. Each option has its own price, availability (volume), and popularity (open interest).
Pro tip: TradeVision highlights the “in-the-money” (ITM) and “out-of-the-money” (OTM) options with color-coded rows so you can instantly spot your opportunity.
How to Read Options Chain: Choosing Strike Prices and Expirations
Now that you understand the layout, the next step is picking the right strike price and expiration date—just like choosing the right product specs before clicking “buy.”
Strike Prices:
- In-the-Money (ITM): Call options where the strike price is below the stock price (or above, for puts). These cost more but are safer.
- Out-of-the-Money (OTM): Cheaper, higher-risk, higher-reward.
Say Apple (AAPL) is trading at $185. A 180 strike call is ITM, while a 190 call is OTM.
Expiration Dates:
- Weeklies: Popular for day traders and short-term moves.
- Monthlies/LEAPS: Better for swing trades or long-term strategies.
If you’re bullish on a stock but expect a move in the next 2 weeks, a weekly OTM call might make sense—but be aware of theta decay (value drops as expiration approaches).
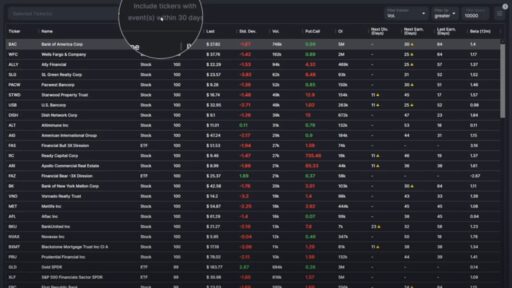
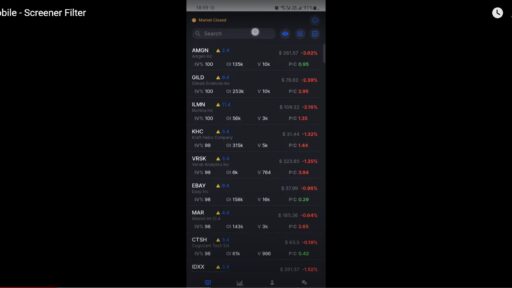
TradeVision simplifies this by letting you filter chains by expiration and highlights volume spikes, so you can focus on hot, high-liquidity trades.

How to Read Options Chain: The Power of Volume, Open Interest, and the Greeks
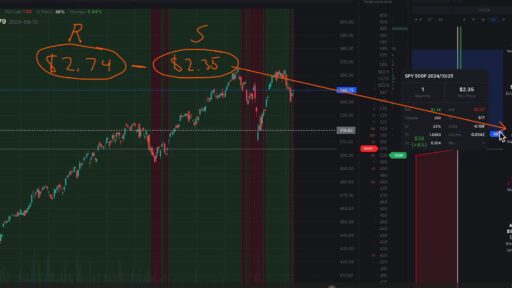
Once you find a strike and expiry that fit your strategy, it’s time to assess liquidity and risk using three tools:
1. Volume & Open Interest (OI):
- Volume = Trades today
- OI = Contracts still open
- High numbers = High liquidity = Easy to enter and exit
For example, a contract with 10,000 in volume and 25,000 OI? That’s a solid, active trade.
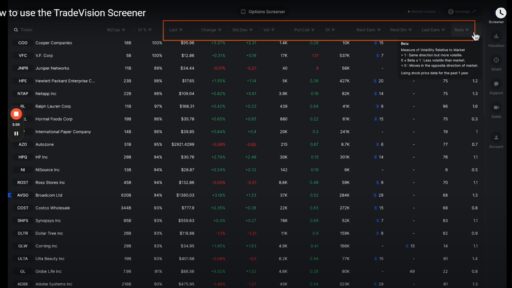
2. The Greeks:
These are metrics that tell you how sensitive an option is to time, movement, and volatility.
- Delta: Price change per $1 move in the stock. (e.g. Delta = 0.50 → Option gains $0.50 if stock rises $1)
- Theta: How much value is lost per day (time decay).
- Gamma, Vega, Rho: More advanced but useful as you grow.
TradeVision overlays these with simple definitions and icons, so you don’t need to memorize formulas to trade like a pro.
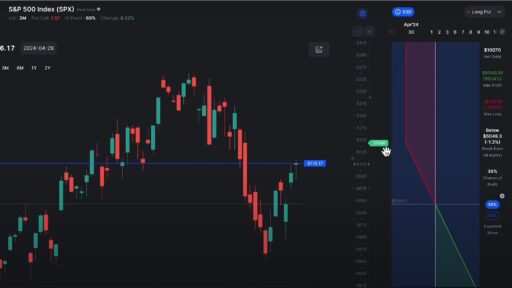
Real Example: Reading the Options Chain for NVIDIA (NVDA)
Let’s say NVDA is trading at $950.
You pull up the May 24 options chain:
| Strike | Call Bid | Call Ask | Put Bid | Put Ask | Volume | OI |
|---|---|---|---|---|---|---|
| 940 | $25.10 | $26.00 | $11.80 | $12.60 | 6,400 | 32,100 |
| 950 | $19.00 | $20.25 | $15.50 | $16.35 | 12,200 | 45,000 |
| 960 | $14.40 | $15.10 | $20.10 | $21.20 | 8,950 | 39,900 |
You notice:
- The 950 strike has the highest volume and narrow bid/ask spread.
- Delta is around 0.50 (balanced).
- Expiration is within 2 weeks (good for short-term plays).
This is a clean, high-confidence trade setup—like seeing an iPhone 15 on sale with 5,000 reviews and a near-perfect score. You just go for it.
Why TradeVision Makes Reading Options Chains Easier
Let’s face it: some platforms bury you in data or overwhelm you with dense visuals. TradeVision was designed for modern traders—especially those just starting out.
Here’s what sets it apart:
- Color-coded chains to highlight ITM/OTM options.
- Real-time data without refresh delays.
- Tooltips for Greeks with human-friendly definitions.
- Custom filters for volume, expiry, and strategy types.
Reading an options chain doesn’t need to be hard—especially when your platform wants you to succeed.
FAQ: How to Read Options Chain
Q: What is the easiest way to understand an options chain as a beginner?
A: Start by focusing on the strike price, expiration date, and volume. Avoid the Greeks until you get comfortable with the basics.
Q: Should I choose in-the-money or out-of-the-money options?
A: ITM options are safer but cost more. OTM options are cheaper but riskier. Your choice depends on how aggressive your strategy is.
Q: Why is volume important?
A: High volume = lots of interest = easier to enter or exit trades. It also signals what other traders are watching.
Q: Can I lose all my money in one trade?
A: Yes, if the option expires worthless. Only trade with money you’re willing to risk, especially with short-dated contracts.
Q: What platform is best for reading options chains?
A: We recommend TradeVision for its clean layout, education-friendly tooltips, and powerful real-time filters.
Final Thoughts: Options Chains Are Your Roadmap
If you’ve made it this far—congrats! You now know how to read an options chain with clarity and confidence. You’ve learned:
- How the layout works (calls, puts, strike prices)
- How to choose the right expiration and strike
- Why volume and open interest matter
- How the Greeks affect price movement
- How platforms like TradeVision simplify your experience
In a year where financial literacy is trending and self-empowered investing is at an all-time high, knowing how to decode the options chain is like holding a map in a treasure hunt. Every cell of that table tells a story—now you know how to read it.