Option trading can be a powerful strategy for traders looking to maximize potential returns in the financial markets. However, options are complex financial instruments, and successful trading requires more than just a basic understanding of calls and puts. One key approach to navigating the world of option trading is technical analysis. Technical analysis provides traders with a way to evaluate price movements, identify trends, and make informed decisions based on historical data.
In this article, we’ll explore the role of technical analysis in option trading, the various tools used by traders, and how it can enhance your trading strategies. We’ll also provide insights into how to use these tools effectively, and answer some frequently asked questions about technical analysis in option trading.
What is Technical Analysis?
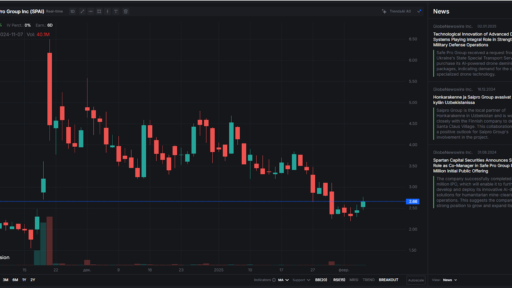
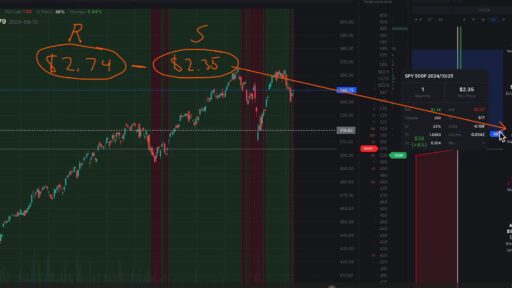
Technical analysis involves the study of price movements in the market using charts and various technical indicators. Unlike fundamental analysis, which focuses on a company’s financial health, technical analysis is based purely on market data—particularly price and volume. The premise behind technical analysis is that historical price movements can provide insights into future price behavior. Traders use these insights to predict trends, price reversals, and overall market sentiment.
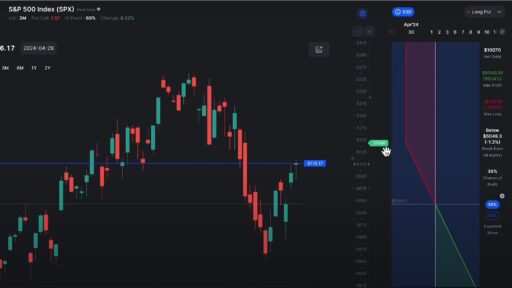
In the context of option trading, technical analysis helps traders identify the best entry and exit points for their trades. By analyzing past price action, traders can assess the likelihood of a certain stock or asset moving in a particular direction, which is crucial when trading options. Successful options traders rely on technical analysis to guide their decisions, whether they’re executing a call option, a put option, or more advanced strategies.
The Role of Technical Indicators in Option Trading
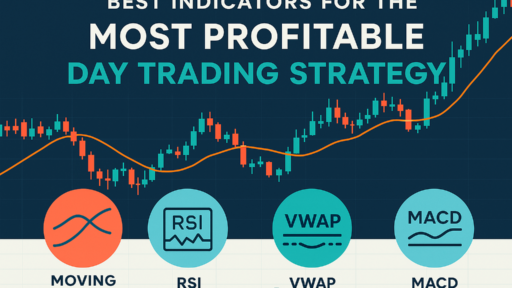
There are several key indicators that option traders often rely on when using technical analysis. These indicators provide insights into market trends, momentum, volatility, and potential reversal points. Here are a few of the most commonly used indicators in option trading:
1. Moving Averages
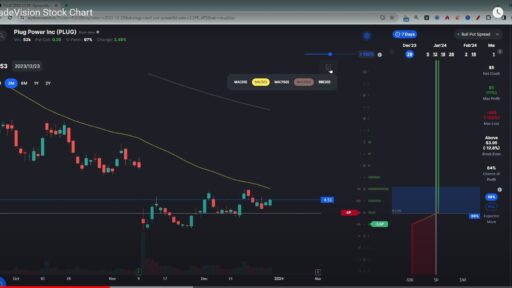
Moving averages are one of the most popular tools used in technical analysis. A moving average smooths out price data over a specific period, helping to identify trends in the market. The two main types of moving averages are the simple moving average (SMA) and the exponential moving average (EMA). Both can help determine the direction of the market and potential turning points. For example, a bullish signal may occur when the short-term moving average crosses above the long-term moving average.
2. Relative Strength Index (RSI)
The Relative Strength Index (RSI) measures the strength of a stock’s price action over a specified period, typically 14 days. RSI values range from 0 to 100, with readings above 70 indicating that a stock is overbought (potential for a price drop) and readings below 30 indicating that a stock is oversold (potential for a price increase). This indicator is helpful for spotting overbought or oversold conditions in a stock, providing insight into when to consider entering or exiting an options position.
3. Bollinger Bands
Bollinger Bands are a volatility indicator that helps traders identify periods of high or low volatility. The bands consist of a moving average (usually 20 periods) and two standard deviation lines above and below the moving average. When the price moves closer to the upper band, it may indicate an overbought condition, while a price nearing the lower band could suggest an oversold condition. Bollinger Bands are particularly useful when trading options, as volatility plays a key role in option pricing.
4. MACD (Moving Average Convergence Divergence)
The MACD is a momentum indicator that helps traders identify changes in the strength, direction, and duration of a trend. The MACD line is calculated by subtracting the 26-day EMA from the 12-day EMA. A signal line is also used, which is a 9-day EMA of the MACD. When the MACD crosses above the signal line, it can indicate a potential buying opportunity, and when it crosses below, it can signal a potential selling opportunity.
Using Chart Patterns to Predict Price Movements
In addition to indicators, traders often use chart patterns to help predict future price movements. These patterns, formed by price data on a chart, represent areas where buyers and sellers are in a battle for control. Some common chart patterns include:
1. Head and Shoulders
The head and shoulders pattern is a reversal pattern that signals a change in the direction of the trend. In a typical head and shoulders pattern, there is a peak (the head) between two smaller peaks (the shoulders). A breakdown below the neckline after the formation of the right shoulder signals a potential bearish reversal.
2. Double Top and Double Bottom
Double top and double bottom patterns are also reversal signals. A double top occurs when an asset’s price reaches a high point twice and then falls below the support level, signaling a potential bearish trend. A double bottom, on the other hand, is the opposite—a price that hits a low twice before rising, signaling a potential bullish trend.
3. Triangles
Triangles are continuation patterns that indicate a period of consolidation before a breakout. There are three types of triangle patterns: ascending, descending, and symmetrical. These patterns suggest that the market is consolidating, and a breakout is likely to occur once the price moves beyond the triangle’s boundaries.

How to Incorporate Technical Analysis in Option Trading
Incorporating technical analysis into your option trading strategy requires a systematic approach. Here’s a simple process you can follow to use technical analysis effectively when trading options:
- Identify the Trend The first step is to determine the overall market trend. Is the market in an uptrend, downtrend, or range-bound? Moving averages, trendlines, and indicators like RSI can help you identify the direction of the trend.
- Select Your Indicator Depending on the strategy you wish to employ, you can choose a combination of indicators. For example, if you’re looking for potential reversals, the RSI and MACD can help identify overbought or oversold conditions. For volatility-based strategies, Bollinger Bands are useful.
- Confirm the Signal Once you’ve identified a potential signal, it’s important to confirm it with additional indicators. For instance, if you see a bullish signal from the MACD, check for confirmation from price action or a moving average crossover.
- Set Entry and Exit Points Once you’ve confirmed your signal, it’s time to establish your entry and exit points. For options traders, this is particularly crucial because of the time-sensitive nature of options. Your entry point might be when a stock breaks out of a triangle pattern, and your exit point could be based on a predetermined level of profit or loss.
- Implement Risk Management Lastly, implement solid risk management practices. This includes setting stop-loss orders, controlling the amount of capital you risk per trade, and having an exit strategy in place if things don’t go as planned.
How to Avoid Common Technical Analysis Pitfalls
While technical analysis can significantly enhance your option trading, there are some common pitfalls to avoid:
- Over-reliance on Indicators Indicators are helpful, but they should not be relied upon in isolation. Always use a combination of indicators and chart patterns to make well-informed decisions.
- Ignoring Market Fundamentals Technical analysis focuses on price action, but ignoring the underlying market fundamentals can be risky. For instance, if a stock is expected to report poor earnings, the price could move contrary to technical indicators.
- Failing to Adapt to Market Conditions Technical analysis is most effective when used with a flexible mindset. Market conditions can change rapidly, and what worked in one market environment might not work in another.
FAQ: Common Questions About Technical Analysis in Option Trading
Q1: How do I know which technical indicator to use for option trading? There is no one-size-fits-all answer. The key is to experiment with different indicators and find what works best for your trading style. Moving averages are great for identifying trends, while the RSI and MACD are helpful for spotting overbought or oversold conditions.
Q2: How can I incorporate technical analysis into my risk management strategy? Technical analysis can help you set realistic entry and exit points based on price levels and indicators. This can improve your risk management by reducing the chances of entering a position at a poor price point.
Q3: Can I rely solely on technical analysis for option trading? While technical analysis is a valuable tool, it’s best used in conjunction with other forms of analysis, including fundamental analysis. Combining the two will provide a more holistic view of the market.
Conclusion
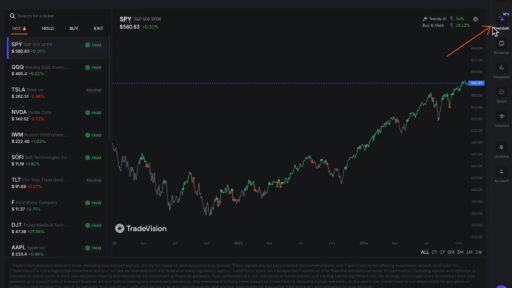
Technical analysis is an essential tool for anyone looking to succeed in option trading. By understanding price trends, using key indicators, and recognizing chart patterns, you can make more informed decisions and develop more effective trading strategies. Tools like TradeVision can assist traders in implementing technical analysis more effectively, helping you refine your approach and improve the accuracy of your trades. Remember that, like any skill, technical analysis takes practice. Start slow, use a disciplined approach, and continuously evaluate your strategy to improve your performance in option trading.


