What Are Bollinger Bands?
Bollinger Bands are a widely-used technical analysis tool that helps traders assess market volatility and identify potential buy or sell opportunities. Developed by John Bollinger in the early 1980s, this tool has become a staple in the toolkit of many traders and investors. Bollinger Bands consist of three key components:
- Middle Band: This is typically a 20-day Simple Moving Average (SMA), representing the average closing prices over the last 20 days.
- Upper Band: Positioned two standard deviations above the middle band, it reflects the price level where the market might be overbought.
- Lower Band: Positioned two standard deviations below the middle band, it indicates the price level where the market might be oversold.
How Do Bollinger Bands Work?
Bollinger Bands are designed to measure the market’s volatility. The middle band (20-day SMA) serves as a baseline, reflecting the average price of an asset over a specified period. The upper and lower bands expand and contract in response to market volatility.
- When volatility increases, the distance between the upper and lower bands widens. This expansion signals that the market is experiencing larger price movements, which could indicate the onset of a new trend.
- When volatility decreases, the bands contract, moving closer together. This contraction often occurs during periods of consolidation, where the price movement is less dramatic, suggesting a potential breakout in the near future.
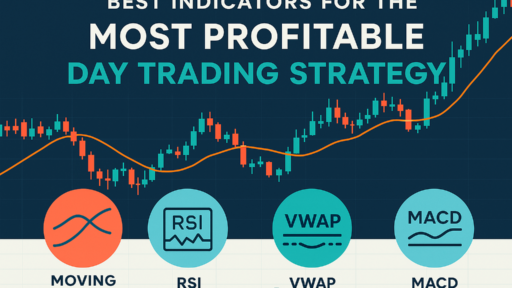
Traders utilize Bollinger Bands to gauge whether prices are relatively high or low, helping them make informed decisions on buying or selling. The tool can be particularly useful when combined with other indicators, such as the Relative Strength Index (RSI) or Moving Average Convergence Divergence (MACD).
Why Are Bollinger Bands Important?
Bollinger Bands are crucial for traders because they provide visual cues about market conditions, helping traders anticipate potential price movements. Understanding how to interpret these bands can significantly enhance a trader’s ability to navigate the markets. Here’s why Bollinger Bands are important:
- Identifying Overbought Conditions: When the price of an asset consistently touches or moves above the upper band, it might indicate that the market is overbought. This scenario suggests that the asset’s price may soon reverse or pull back. Traders may consider this a signal to sell or short the asset to capitalize on a potential downturn.
- Spotting Oversold Conditions: Conversely, when the price nears or drops below the lower band, it might indicate that the market is oversold. This scenario suggests that the asset’s price is undervalued, possibly signaling a buying opportunity. Traders may interpret this as a cue to purchase the asset, anticipating a price increase.

How to Use Bollinger Bands Effectively
While Bollinger Bands are a powerful tool, they are most effective when used in conjunction with other technical indicators and strategies. For instance, combining Bollinger Bands with the Relative Strength Index (RSI) can help confirm potential buy or sell signals. Additionally, understanding market context and being aware of key support and resistance levels can further enhance the accuracy of Bollinger Band signals.
Conclusion
Bollinger Bands are an essential tool for traders looking to understand market volatility and make more informed trading decisions. By learning how to interpret these bands and combining them with other indicators, traders can develop a more comprehensive trading strategy that accounts for both price trends and market conditions. Whether you’re a seasoned trader or just starting, incorporating Bollinger Bands into your analysis can provide valuable insights that may improve your trading outcomes. For more detailed strategies and concepts, explore the resources at TastyLive and TradeVision, where you can deepen your understanding of how to apply Bollinger Bands and other trading tools effectively.


