In 2025, the world of day trading is evolving faster than ever. From the rise of zero-day options to AI-enhanced technical analysis, the playing field has changed — and traders who want to stay profitable must keep adapting. One thing that hasn’t changed? The value of solid, reliable technical indicators.
If you’re looking to develop or refine the most profitable day trading strategy, understanding how to use indicators effectively is absolutely crucial. In this article, we’ll explore the top indicators that traders are using today — and how to combine them for maximum edge. Whether you’re trading stocks, crypto, or forex, these tools can help you trade smarter, not harder.
Why Indicators Matter in the Most Profitable Day Trading Strategy
Let’s get this straight: no indicator is a crystal ball. But they can absolutely sharpen your instincts, reveal patterns, and help time your trades more effectively.
At their core, indicators are mathematical tools based on price, volume, or momentum. They help traders:
- Identify trends
- Spot reversals
- Gauge volatility
- Time entries and exits with greater precision
The key isn’t just using them — it’s using the right ones, at the right time, in a way that complements your style. That’s where strategy and discipline come into play.
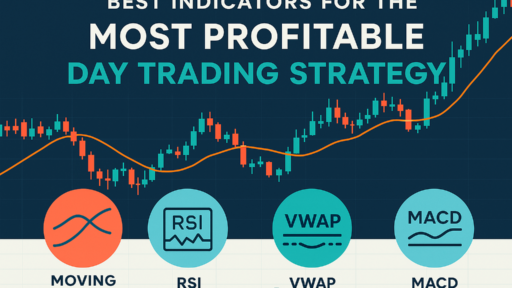
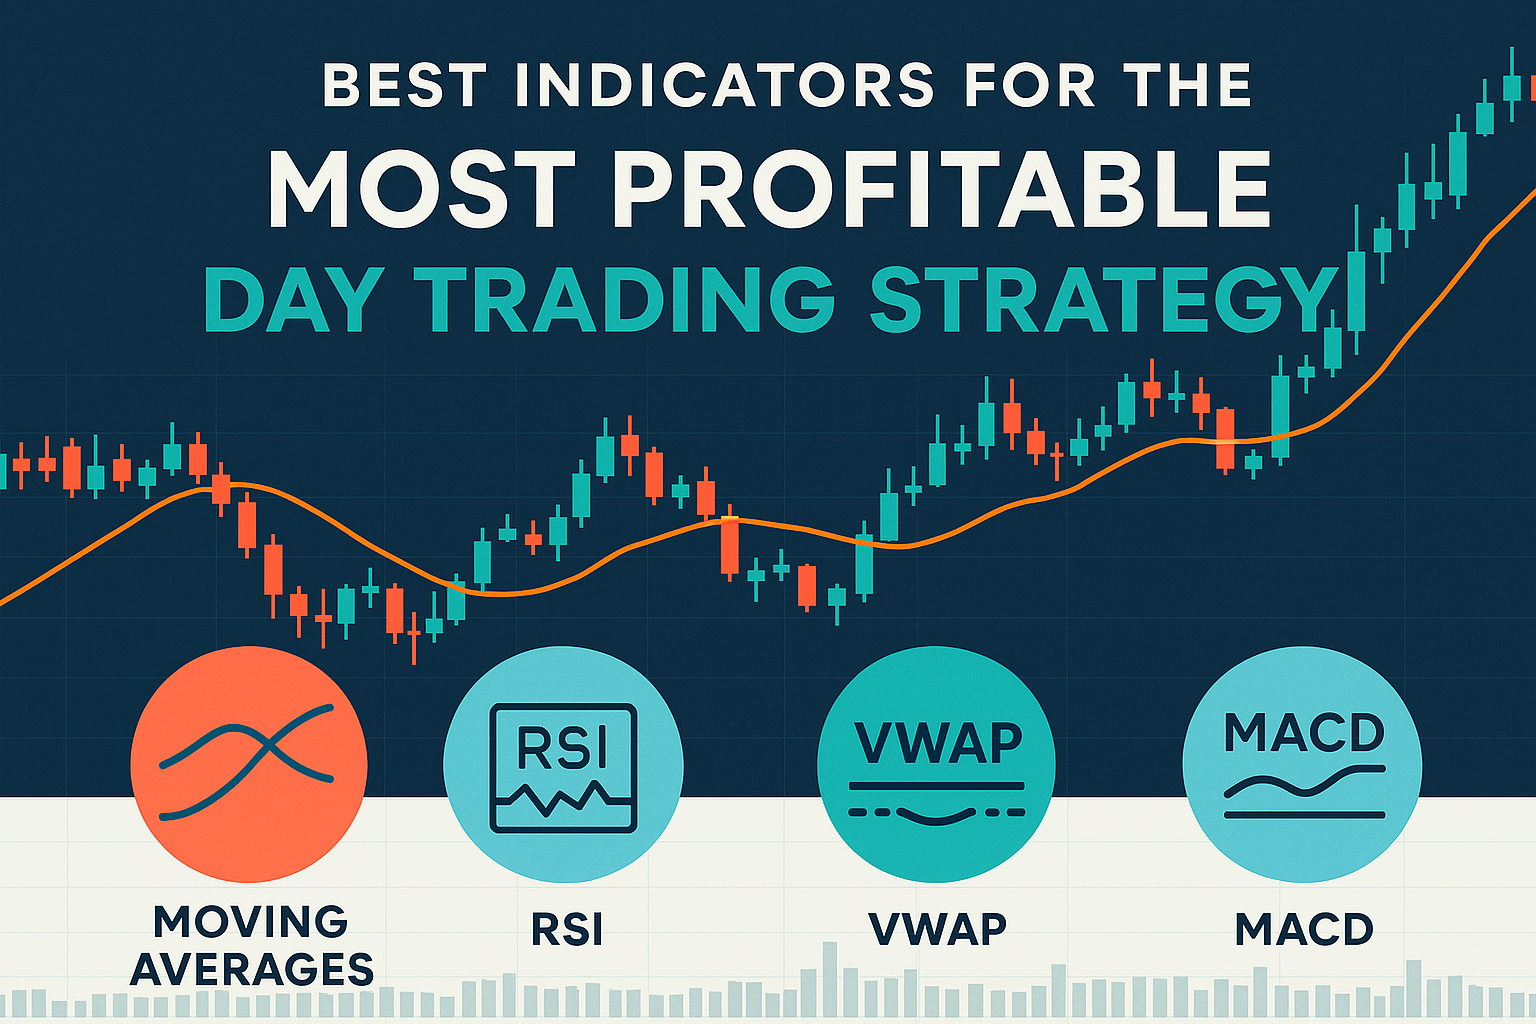
Top Indicators That Power the Most Profitable Day Trading Strategy in 2025
Let’s dig into the indicators that consistently show up in high-performing strategies this year.
1. Exponential Moving Averages (EMAs)
Foundating in many investors playbooks are moving averages. Day traders particularly like EMAs (especially the 9 and 21period) since they give more weight to recent data, which makes them very reactive.
Why use it?
It assists in identifying dynamic support/resistance levels as well as trend direction. A crossover of short and long EMAs can suggest a change in market dynamics.
2. Relative Strength Index (RSI)
RSI remains one of the most trusted momentum indicators. It measures how overbought or oversold an asset is on a scale from 0 to 100.
Pro tip: In a trending market, RSI can stay overbought/oversold for longer than expected — so context is key. Combine RSI with trend indicators for more accurate signals.
3. Volume Weighted Average Price (VWAP)
VWAP is loved by institutional traders — and for good reason. It gives a weighted average price based on both volume and price, showing where the “fair” price lies throughout the day.
How to use it:
- Prices above VWAP can indicate bullish bias
- Prices below suggest bearish conditions
It’s particularly useful during the first hour of the trading day and during key reversals.
4. MACD (Moving Average Convergence Divergence)
MACD is a momentum and trend indicator all in one. It shows the relationship between two EMAs and includes a histogram to visualize momentum shifts.
Watch for:
- MACD line crossing above the signal line = bullish signal
- MACD line crossing below = bearish
When used in conjunction with price action and support/resistance levels, MACD can be incredibly powerful for confirming trade setups.
5. Bollinger Bands Bollinger Bands enable investors to grasp price extremes in the highvolatility setting of nowadays (notably cryptocurrency).
Volatility determines how much the upper and lower bands expand and contract. Price could be ready for a pullback when it crosses either band—or it may indicate a breakout. Combine for improved definition with volume.

How to Use These Indicators Together Without Overloading
Here’s where many traders go wrong — they stack too many indicators on one chart. Instead, try this combo for a clean, balanced approach:
- EMA (9/21) for trend direction
- RSI to spot momentum shifts
- VWAP for intraday “fair value”
- MACD as a confirmation tool
That will create a strong system free of paralysis from overanalysis.
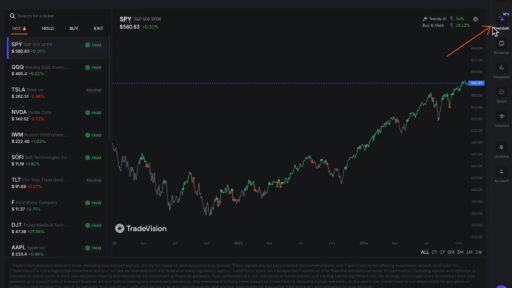
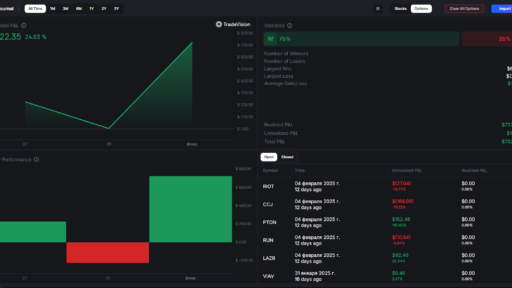
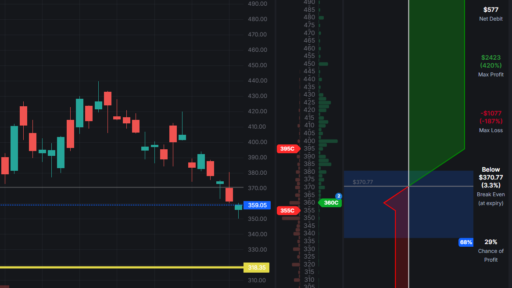
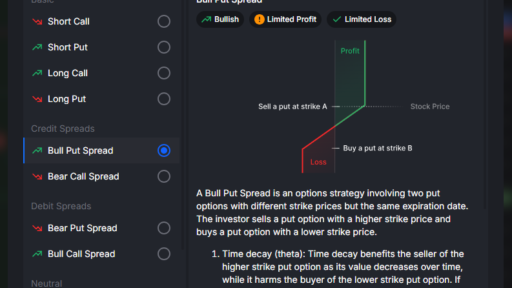
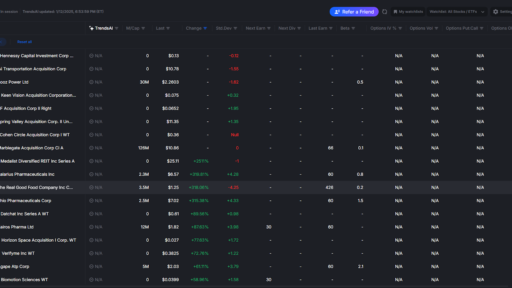
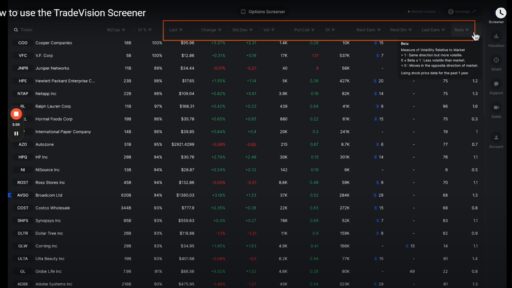
And if you don’t like to manually cobble indicators together or simply want to try your configurations more rapidly, there are a few intelligent systems available. One becoming more popular is TradaVision.
It is nice that you can set up custom approaches, layer several signals, and even simulate transactions without having to go through many hoops. Especially for those still trying to determine their style, it is natural; it also assists to cut through the noise when quick decisions are called for.
Back testing: The Secret Sauce to a Profitable Strategy
Even with the perfect set of indicators, no strategy is complete without backtesting. This is how you prove (or disprove) your system before risking real capital.
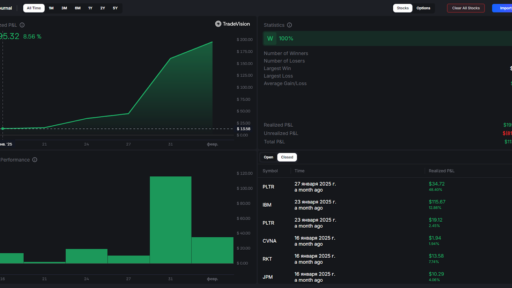
What to look for when backtesting:
- Win rate (anything above 50% is a good start)
- Risk-to-reward ratio (aim for at least 1:2)
- Drawdowns (how much are you risking at any given time?)
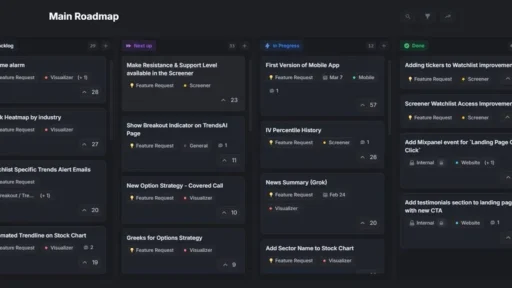
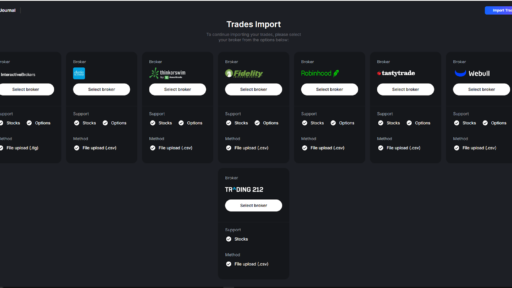
Platforms like TradaVision make this process easier with built-in backtesting tools, so you can tweak your strategy without leaving the platform or coding anything yourself.
FAQs About Indicators and the Most Profitable Day Trading Strategy
Q: Can I use just one indicator and still be profitable?
A: Technically, yes — some traders swear by price action plus a single indicator. But for most, using two or three complementary indicators helps reduce false signals.
Q: What’s the best timeframe for day trading indicators?
A: The 1-minute, 5-minute, and 15-minute charts are most common. That said, many traders look at higher timeframes (like 1-hour) for context.
Q: How do I know if an indicator is working for me?
A: Track your trades! If your setups based on that indicator consistently lead to positive outcomes — it’s working. If not, reassess or try different parameters.
Q: Should I pay for advanced indicators?
A: Not necessarily. Most successful traders still rely on the classics. But paid platforms (like TradaVision) can be worth it if they offer cleaner interfaces, strategy building, or faster data access.
Q: How often should I update or change my indicators?
A: Only when you have a reason. Don’t chase the “new shiny tool” — but if market conditions shift, it’s smart to re-evaluate your setup.
Final Thoughts
Knowing how to use indicators together, how to adjust to changing markets, and how to remain disciplined is maybe even more important than simply having the “correct” indicator.
Stick to a system, test it thoroughly, and evolve with the market. Consistency is the key—whether you are developing your approach manually or with a clever trading assistant like TradaVision.