Navigating the world of stock trading can be overwhelming, but with the right tools and a solid understanding of technical analysis, you can make more informed decisions. Let’s dive into some straightforward methods for analyzing stock charts and leveraging trading tools to help you strategize effectively.
Decoding the Stock Chart
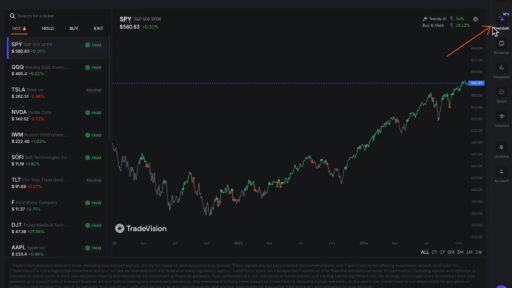
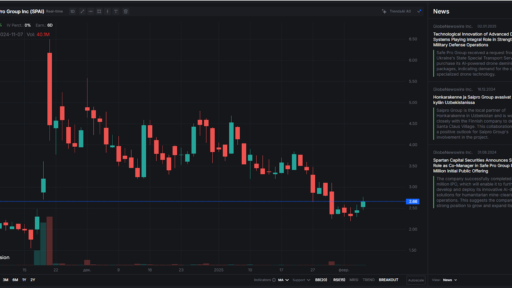
When you pull up a stock chart, you’ll notice several key components:
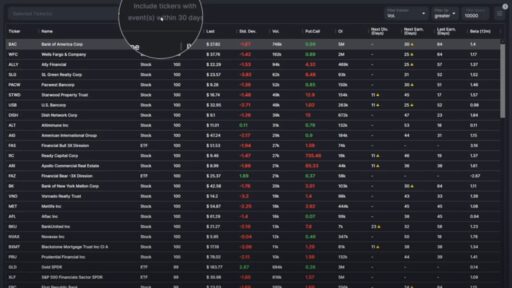
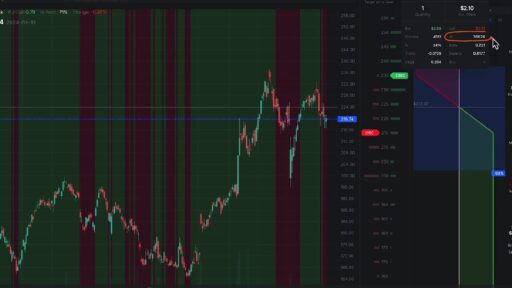
- Volume Indicator: At the bottom of the chart, you’ll see the volume of shares traded. This is crucial because it provides insight into the stock’s activity and can signal the strength of a price movement.
- Earnings Dates: Historical and upcoming earnings dates are marked on the chart. For instance, if the next earnings date is March 6th, this could impact the stock’s volatility leading up to and following that date.
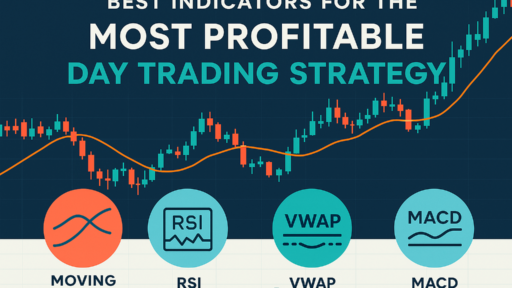
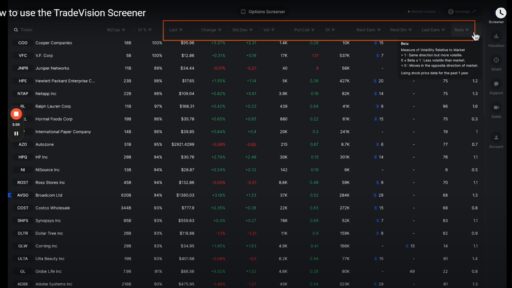
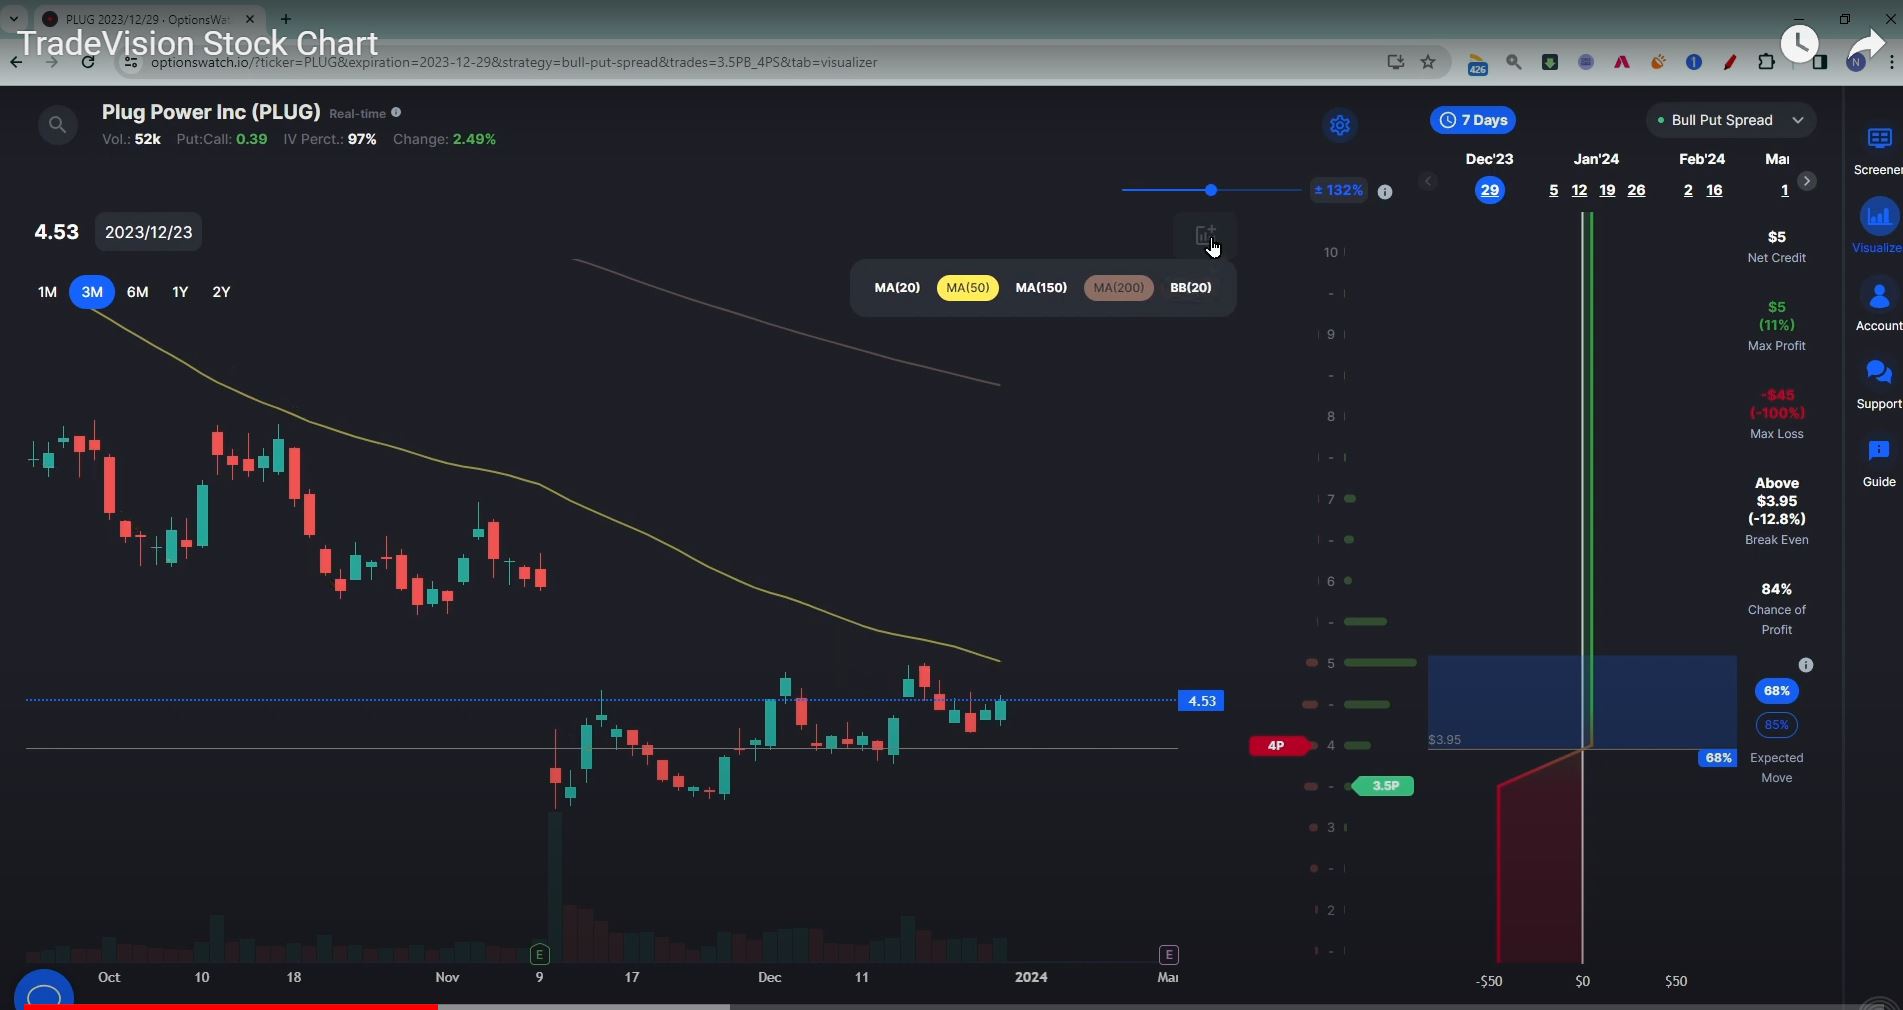
- Technical Indicators: Enhance your analysis by adding technical indicators from the toolbar at the top of your chart. Commonly used indicators include:
- 50-Day Moving Average: This shows the average price over the past 50 days and helps smooth out short-term fluctuations.
- 200-Day Moving Average: This indicator gives a longer-term view of the stock’s trend.
- Bollinger Bands: These bands show volatility and potential overbought or oversold conditions.

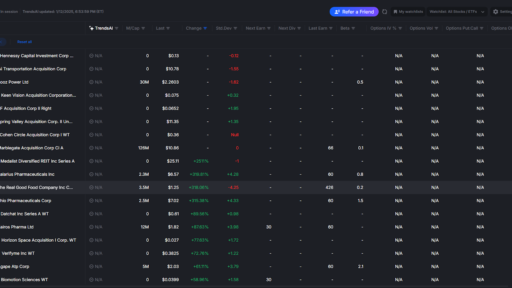
Analyzing Market Trends
To understand whether a stock is in a bullish or bearish trend, you might use these tools:
- Zoom In and Out: Adjust the time frame to see short-term or long-term trends. For instance, if you zoom out and the setup remains bearish, this might suggest a continued downtrend.
- Technical Setup: Look at the current indicators and chart patterns. If the indicators suggest a bearish setup, you might need to consider strategies that hedge against potential losses.
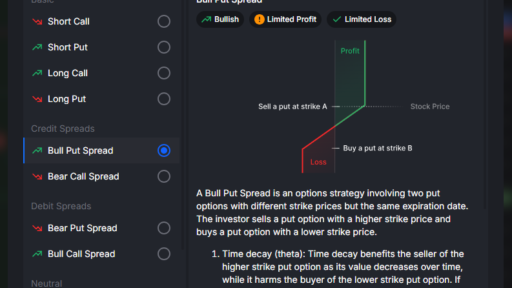
Crafting Your Trading Strategy
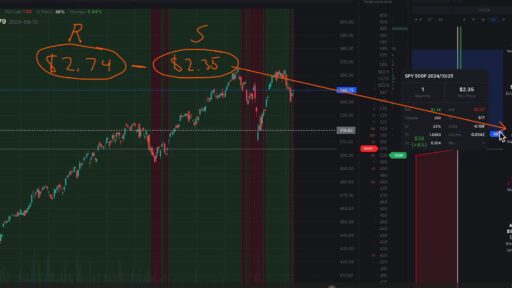
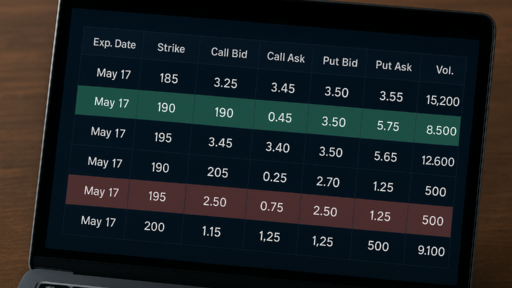
Once you’ve analyzed the chart, you can tailor your strategy using the drop-down list of options at the top. Here’s how to assess your trade setup:
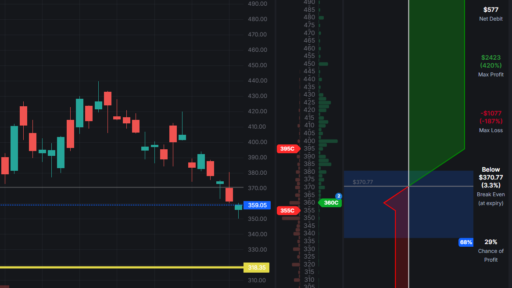
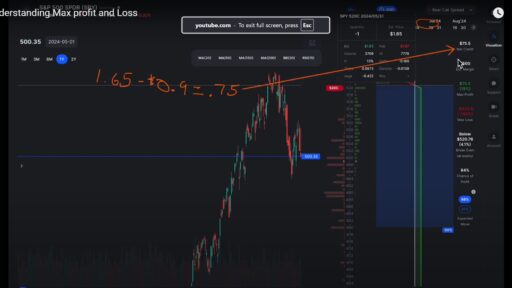
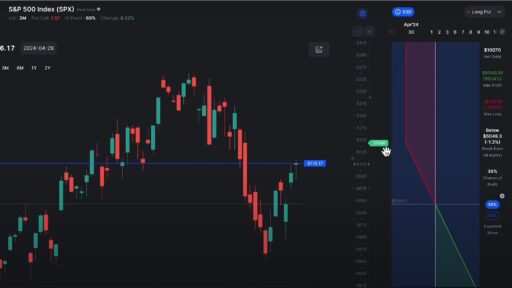
- Break-Even Line: When you set up a trade, a gray line on the chart represents your break-even point. For example, if your trade setup shows a break-even price of $396, but the current market price is $453, you are 12.7% below the market price with your break-even point.
- Profit and Loss Calculations: The tool will show:
- Chance of Profit: For instance, an 84% chance of profit indicates a strong likelihood of a successful trade.
- Max Loss and Max Profit: These values are shown in both percentage and dollar terms, helping you assess the risk and reward of the trade.
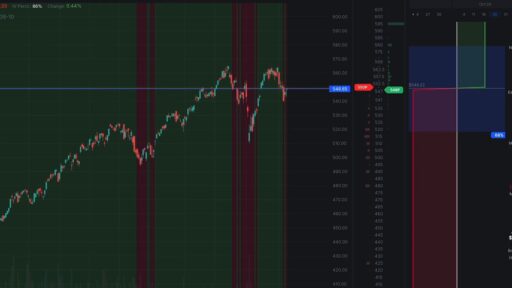
- Expected Market Move: The blue area on the chart shows the expected price movement with a 68% probability. You can also adjust this to a more conservative 85% probability to account for higher market uncertainty.
Conclusion
Technical analysis and trading tools are powerful allies in making educated trading decisions. By understanding and utilizing volume indicators, earnings dates, and various technical indicators, you can gain a clearer picture of market trends. Customizing your strategies based on these insights allows you to better navigate the complexities of stock trading and work towards achieving your financial goals.